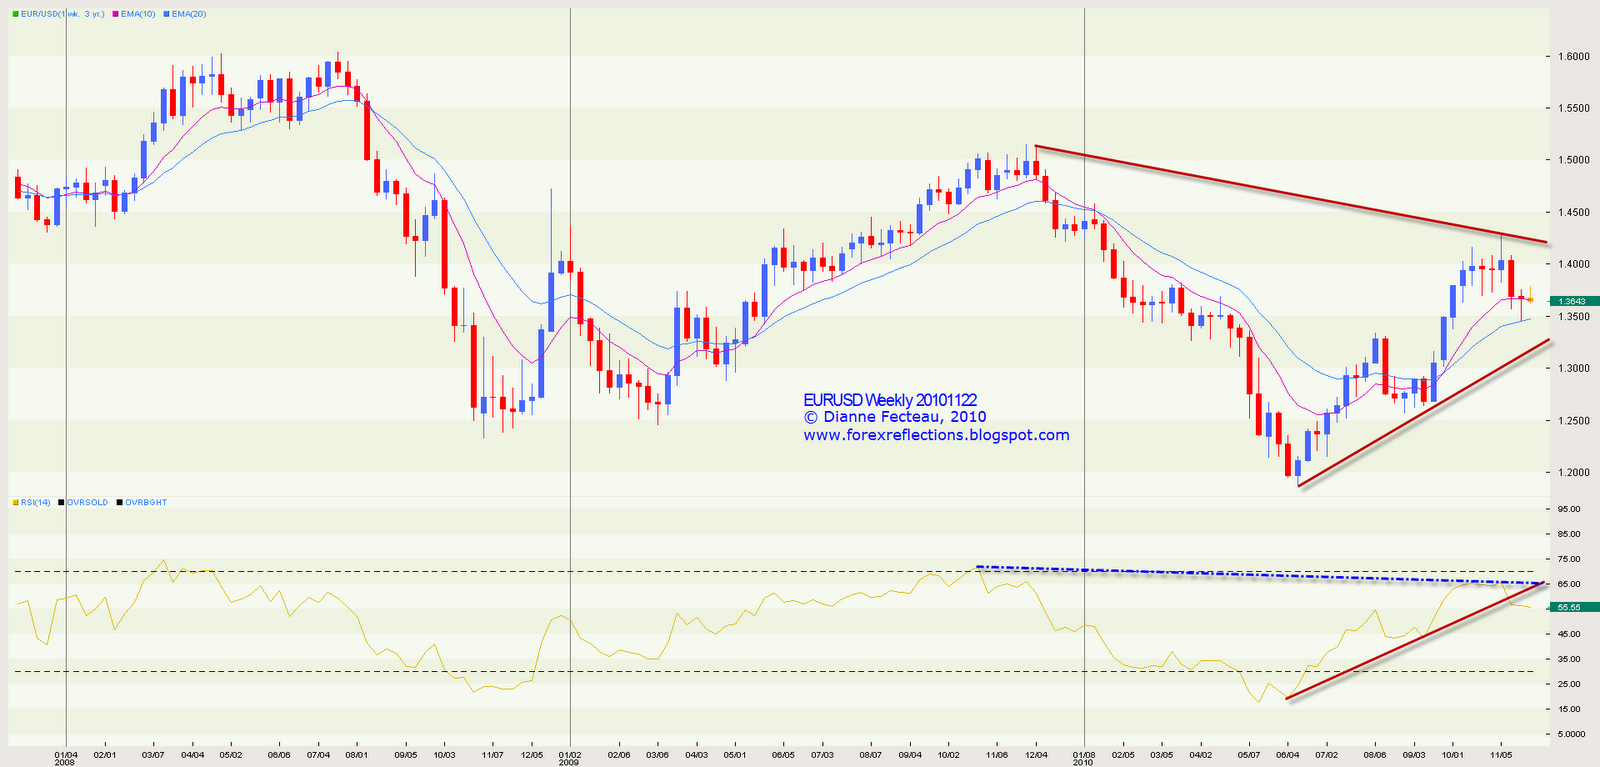
If the pair breaks the round number at 1.36, support on the weekly chart is at 1.3447 (the hammer), 1.3335 (August high) and 1.3270 (weekly uptrend line from June). RSI has broken below its uptrend line so it's reasonable to watch for whether price might do so as well. There's a resistance zone between 1.3800 and 1.3865 (round number, Elliott Wave count, 50% fibo, and polarity).
Here's the weekly chart:
© Dianne Fecteau, 2010. No part of this material may be reproduced in any form, or referred to in any other publication, without the express written permission of the author.
My purpose in writing this blog is to show you how one trader, me, makes trading decisions and survives while trading Forex. One of the biggest problems I had when I first started trading was trying to apply the “rules” to actual trades. Another was the psychology—limiting losses and letting profits run. If you study my blog, you’ll see how I deal with both those issues. So my writings are not trade recommendations but rather educational in purpose. You have to decide on your own approach to trading. Remember that trading is risky.
No comments:
Post a Comment