I took a long position in AUDUSD at .9119 based on the momentum move on the hourly chart as explained in prior post. I have already moved the stop to breakeven. If it dips below and takes me out, I’ll have to assess price action at that time to see if I re-buy.
© Dianne Fecteau, 2009. No part of this material may be reproduced in any form, or referred to in any other publication, without the express written permission of the author.
My purpose in writing this blog is to show you how one trader, me, makes trading decisions and survives while trading Forex. One of the biggest problems I had when I first started trading was trying to apply the “rules” to actual trades. Another was the psychology—limiting losses and letting profits run. If you study my blog you’ll see how I deal with both those issues. So my writings are not trade recommendations but rather educational in purpose. You have to decide on your own approach to trading. Remember that trading is risky.
Friday, November 20, 2009
AUDUSD—Decision time?
I wrote yesterday that I wouldn’t trade AUDUSD because it didn’t drop to its daily uptrend line at .9090. Although it came reasonably close at .9132, it’s about drawing your lines in the sand. Am I glad I didn’t? Of course, now that the low this morning has been .9061. But what if it had gone up from .9132 instead of down? Then it would have gone up without me. Some trades get away.
But now the pair has my attention and a decision may be near. It broke its trend line but hasn’t had a close below that line on the daily, 3-, or 1-hour charts. Looking at the hourly chart offers no clue that this move downward is over. On the 15-minute chart, there’s finally a candle that’s indecisive. That’s not enough to enter a trade. The daily trend is still up but there are now clues on the 3-hour chart that its trend may be reversing. Adding to this is that .9115/20 was polarity and it did close below that on the hourly chart. So going long at the moment is problematic.
I’m not ready to short, either. First, I can’t catch a falling knife if it continues to drop. I need a rally with signs that it’s just that.
What would convince me to try a long is a momentum push as represented by RSI. That would take a definitive close on the hourly chart with a bullish candle and RSI being greater than 30. We’ll just have to wait and see. Here’s the hourly chart:

© Dianne Fecteau, 2009. No part of this material may be reproduced in any form, or referred to in any other publication, without the express written permission of the author.
My purpose in writing this blog is to show you how one trader, me, makes trading decisions and survives while trading Forex. One of the biggest problems I had when I first started trading was trying to apply the “rules” to actual trades. Another was the psychology—limiting losses and letting profits run. If you study my blog you’ll see how I deal with both those issues. So my writings are not trade recommendations but rather educational in purpose. You have to decide on your own approach to trading. Remember that trading is risky.
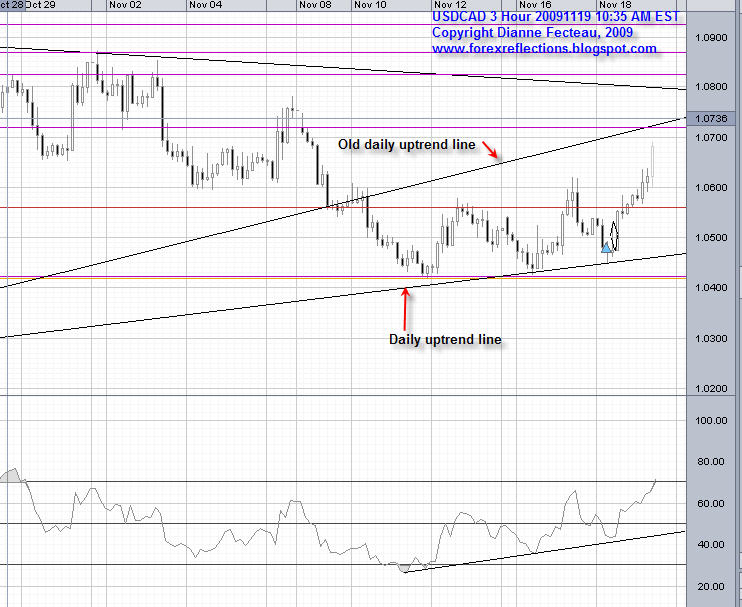
USDCAD—Déjà vu all over again
I could be writing this yesterday—in fact I did! I wrote that my trade was up 199 pips and as of this moment, 6:56 AM EST, it’s up 196 pips. So clearly the pair is hesitating a bit. You now see two trades on the chart. The first is my original from 1.0490. I wrote that I took some partial profits at 199 pips and I decided to replace that amount with another trade on the slight dip to 1.0635. That trade now has a stop above breakeven.
I’ve labeled three trend lines on the chart. The pair appears to be coiling within the downtrend line from July and the new daily uptrend line. The coiling means the pair is building up energy. How that energy ultimately manifests itself will be interesting. Nobody, but nobody, can predict with certainty the direction it will take. What we can do, though, is watch price behavior and act on its direction. The market tells you what to do. While I’ve been “validated” in my belief since mid-October that the pair is basing, that doesn’t mean I’m correct overall. This pair has technically not yet reversed its overall downward trend from March. That means it still could violate the 1.0208 low. And you can believe me when I say that I will then change my opinion completely and happily short with the best of them. It’s important to not get married to your opinions. All that said, obviously I’m staying long for now. The resistance levels I wrote about yesterday are still present. I’ll just keep an eye on the charts. Here’s the three hour chart:

© Dianne Fecteau, 2009. No part of this material may be reproduced in any form, or referred to in any other publication, without the express written permission of the author.
My purpose in writing this blog is to show you how one trader, me, makes trading decisions and survives while trading Forex. One of the biggest problems I had when I first started trading was trying to apply the “rules” to actual trades. Another was the psychology—limiting losses and letting profits run. If you study my blog you’ll see how I deal with both those issues. So my writings are not trade recommendations but rather educational in purpose. You have to decide on your own approach to trading. Remember that trading is risky.
Thursday, November 19, 2009
AUDUSD—Getting ready for another run at the top?
AUDUSD is still in an uptrend with no good signs of a trend reversal yet. But it’s finding resistance at the .9400 level. Momentum is still good on the daily chart. I was hoping it would drop to its daily uptrend line at .9090 where I could buy but its low, so far, has been .9132. Close enough? Maybe. But you have to draw your line in the sand somewhere and mine was lower than that. On the three hour chart you can see a Head and Shoulders pattern. It has broken the neckline at .9155 but has climbed back inside. Action in the lower time frames will tell the story eventually.
Here’s the three hour chart:

© Dianne Fecteau, 2009. No part of this material may be reproduced in any form, or referred to in any other publication, without the express written permission of the author.
My purpose in writing this blog is to show you how one trader, me, makes trading decisions and survives while trading Forex. One of the biggest problems I had when I first started trading was trying to apply the “rules” to actual trades. Another was the psychology—limiting losses and letting profits run. If you study my blog you’ll see how I deal with both those issues. So my writings are not trade recommendations but rather educational in purpose. You have to decide on your own approach to trading. Remember that trading is risky.
USDCAD—Logical Resistance Levels
USDCAD followed a classically, beautiful path to its current high of 1.0689, up from where I bought at 1.0490 (199 pips). I lightened just a bit here but have much of the trade still on with, of course, a profit stop. If you read my blogs from the last few days you saw why I was comfortable buying again, using no fancy or mystical techniques but rather relying on classical technical analysis. The diamond pattern that appeared yesterday was frosting on the cake.
Anybody can make consistent pips in the market if they:
1) Do the analysis—this means putting in the hours studying charts
2) Exercise iron discipline as to entry points so potential losses are small.
3) Be patient
All this is easier said than done, of course. Otherwise everyone would just do it. Of the three steps above, the first, while requiring work, is actually the most straightforward. Discipline and patience are much harder to come by. I’ve had to consistently work on myself—my attitude, my awareness, and my emotions—to get to the place where I can maintain a reasonably detached demeanor in my trading. I still get annoyed; I still struggle with changing direction when I need to do so. But it’s easier than it once was and I’m a pretty stubborn person. If I can do it, anyone can. OK, that’s the end of the back patting for a nice trade. Satisfaction with oneself can also get in the way of successful trading. Time to shake it all off and move on.
Looking at the daily and three-hour chart, there are four logical resistance levels for the USDCAD:
1) 1.0718
2) 1.0796
3) 1.0826/70
4) 1.0924/66
Support can be found at 1.0450/66 and 1.0561/89.
Here’s the three-hour chart where I’ve marked resistance levels in purple. Let’s see if it can make it through the next one. I’ll be watching shorter time periods as well as momentum as measured by RSI.

© Dianne Fecteau, 2009. No part of this material may be reproduced in any form, or referred to in any other publication, without the express written permission of the author.
My purpose in writing this blog is to show you how one trader, me, makes trading decisions and survives while trading Forex. One of the biggest problems I had when I first started trading was trying to apply the “rules” to actual trades. Another was the psychology—limiting losses and letting profits run. If you study my blog you’ll see how I deal with both those issues. So my writings are not trade recommendations but rather educational in purpose. You have to decide on your own approach to trading. Remember that trading is risky.
Anybody can make consistent pips in the market if they:
1) Do the analysis—this means putting in the hours studying charts
2) Exercise iron discipline as to entry points so potential losses are small.
3) Be patient
All this is easier said than done, of course. Otherwise everyone would just do it. Of the three steps above, the first, while requiring work, is actually the most straightforward. Discipline and patience are much harder to come by. I’ve had to consistently work on myself—my attitude, my awareness, and my emotions—to get to the place where I can maintain a reasonably detached demeanor in my trading. I still get annoyed; I still struggle with changing direction when I need to do so. But it’s easier than it once was and I’m a pretty stubborn person. If I can do it, anyone can. OK, that’s the end of the back patting for a nice trade. Satisfaction with oneself can also get in the way of successful trading. Time to shake it all off and move on.
Looking at the daily and three-hour chart, there are four logical resistance levels for the USDCAD:
1) 1.0718
2) 1.0796
3) 1.0826/70
4) 1.0924/66
Support can be found at 1.0450/66 and 1.0561/89.
Here’s the three-hour chart where I’ve marked resistance levels in purple. Let’s see if it can make it through the next one. I’ll be watching shorter time periods as well as momentum as measured by RSI.
© Dianne Fecteau, 2009. No part of this material may be reproduced in any form, or referred to in any other publication, without the express written permission of the author.
My purpose in writing this blog is to show you how one trader, me, makes trading decisions and survives while trading Forex. One of the biggest problems I had when I first started trading was trying to apply the “rules” to actual trades. Another was the psychology—limiting losses and letting profits run. If you study my blog you’ll see how I deal with both those issues. So my writings are not trade recommendations but rather educational in purpose. You have to decide on your own approach to trading. Remember that trading is risky.
EURUSD—Yet another diamond
Diamonds are relatively rare patterns. But yesterday one appeared in the USDCAD as I blogged. Later, I noticed one on the EURUSD hourly chart. I closed my long at 1.4926 (bought at 1.4864 so 62 pips profit) and opened two short positions at 1.4919 and 1.4924. It’s not easy to close a trade that’s in profit on a pair that still seems to have bullish momentum. But it’s what I was committed to doing. So I did.
The double top was confirmed at 1.4919. The high yesterday was 1.4991. Now what? It’s approaching both support and the RSI oversold level on the hourly chart. Remember that yesterday I bought because it climbed out of oversold and the candles were bullish. So I’ll continue to study this today. Momentum must fall on the daily chart before any serious moves down take place. We’ll see that on the shorter time frames first. Stay flexible and gather your pips where you may while it’s in this potential trend reversal area. Here’s the one hour chart:

© Dianne Fecteau, 2009. No part of this material may be reproduced in any form, or referred to in any other publication, without the express written permission of the author.
My purpose in writing this blog is to show you how one trader, me, makes trading decisions and survives while trading Forex. One of the biggest problems I had when I first started trading was trying to apply the “rules” to actual trades. Another was the psychology—limiting losses and letting profits run. If you study my blog you’ll see how I deal with both those issues. So my writings are not trade recommendations but rather educational in purpose. You have to decide on your own approach to trading. Remember that trading is risky.
USDCAD—Nice climb
The diamond formation on the 15-minute chart, that I posted yesterday, paid off. My trade is currently up 120 pips. Remember, though, the diamond pattern appeared after I set up my trade. It supported what was already on the chart. The pair just climbed through some serious resistance at 1.0590 but it’s going to have to push on up through the 1.06 area. Let’s see if it can do that or whether it will fall back in despair at the anti-USD sentiment. Here’s the 15 minute chart:

© Dianne Fecteau, 2009. No part of this material may be reproduced in any form, or referred to in any other publication, without the express written permission of the author.
My purpose in writing this blog is to show you how one trader, me, makes trading decisions and survives while trading Forex. One of the biggest problems I had when I first started trading was trying to apply the “rules” to actual trades. Another was the psychology—limiting losses and letting profits run. If you study my blog you’ll see how I deal with both those issues. So my writings are not trade recommendations but rather educational in purpose. You have to decide on your own approach to trading. Remember that trading is risky.
Wednesday, November 18, 2009
USDCAD—Little diamond
There’s a nice little diamond formation on the 15-minute chart. When these break, they usually break fast. Too bad, it’s not on a longer time frame. Let’s see what happens:

© Dianne Fecteau, 2009. No part of this material may be reproduced in any form, or referred to in any other publication, without the express written permission of the author.
My purpose in writing this blog is to show you how one trader, me, makes trading decisions and survives while trading Forex. One of the biggest problems I had when I first started trading was trying to apply the “rules” to actual trades. Another was the psychology—limiting losses and letting profits run. If you study my blog you’ll see how I deal with both those issues. So my writings are not trade recommendations but rather educational in purpose. You have to decide on your own approach to trading. Remember that trading is risky.
USDCAD—Got to see some action!
The remainder of the trade I was in (from 1.0453), profit stopped out at +50 pips in yesterday’s zippity-doo-dah dip. I bought again at 1.0490. I don’t think I have to list my reasons for doing so since they’re in yesterday’s blog.
Trading is fairly boring today. The low this morning was 1.0450; it reached a high of 1.0530. The pair’s daily, average true range (ATR) is about 135 pips so it’s running slightly behind that. ATR is a measure of the average number of pips that a pair moves in any given time period. It can be useful for judging volatility and for giving you an idea of how much potential may be in any given move.
On the hourly chart, the pair displayed a double bottom with the pattern confirmed when it moved above 1.0493. However, as I said, it only reached 1.0530 before falling back in what must have been a sort of a faint as in faint-hearted. But maybe it was a feint. What a cheery thought! I don’t like these candles with the shadows, though.
Here’s the three-hour chart:

© Dianne Fecteau, 2009. No part of this material may be reproduced in any form, or referred to in any other publication, without the express written permission of the author.
My purpose in writing this blog is to show you how one trader, me, makes trading decisions and survives while trading Forex. One of the biggest problems I had when I first started trading was trying to apply the “rules” to actual trades. Another was the psychology—limiting losses and letting profits run. If you study my blog you’ll see how I deal with both those issues. So my writings are not trade recommendations but rather educational in purpose. You have to decide on your own approach to trading. Remember that trading is risky.
EURUSD—For now, up
I wrote yesterday that, although I was holding a short, if RSI started climbing out of oversold and a bullish candle formed on the hourly chart, I’d consider a long. As I explained, there didn’t seem to be a strong direction but the Euro was resisting falling with momentum holding its own on the daily chart. Thus, if momentum on the short-term chart fell into line with that on the longer term chart, I’d want to be in that direction. This is exactly what happened on the hourly chart.
Euro dropped to a low of 1.4808, just below the support level it’s been holding on prior drops. The fact that it dipped just below is telling, though. It might drop lower the next time down. Regardless, the hourly candle closed at 1.4829 with RSI oversold at 20.90. I stayed in my short because I had no other clues to work from. The next candle closed at 1.4846 with RSI staying oversold but rising to 28.57. To say the pair had my attention is understating the case. Then, the third candle closed at 1.4856 and RSI was out of oversold at 32.74. This was what I was watching for. Clearly, the drop was over for now. I closed my short at 1.4854 (profit of 107 pips) and bought at 1.4864. Obviously, I’m profit stopped at this time since it climbed from there.
Let’s see where it goes. The place where it tops out this time should be informative. I will be ready to short again because the overall direction is unclear. Might as well grab some pips where they are. Here’s the hourly chart:

© Dianne Fecteau, 2009. No part of this material may be reproduced in any form, or referred to in any other publication, without the express written permission of the author.
My purpose in writing this blog is to show you how one trader, me, makes trading decisions and survives while trading Forex. One of the biggest problems I had when I first started trading was trying to apply the “rules” to actual trades. Another was the psychology—limiting losses and letting profits run. If you study my blog you’ll see how I deal with both those issues. So my writings are not trade recommendations but rather educational in purpose. You have to decide on your own approach to trading. Remember that trading is risky.
Tuesday, November 17, 2009
EURUSD—What’s the Euro doing?
On the daily chart it looks a bit messy with Euro coiling a bit, breaking up, breaking back down, and, in general, sullenly mulling about without a clear direction. I’ll start with the hourly chart, though.
Since last week it has dropped to a low of 1.4627, then climbed back to reach 1.5015. That’s still below the 1.5060 that I hypothesized could be the end of the ABC Elliott Wave (EW) correction from March. (That’s all you can do with EW or any approach is hypothesize and look for clues—there's no definitive answer). I shorted at 1.4961 based on the generally bearish candles on the hourly chart, along with the rounding shape of RSI which hinted at falling momentum. Now it’s approaching 1.4813, a level that has served as support on prior drops. Will it catch it this time? I can’t wait to find out. Meanwhile, I took some profits off the table this morning at 125 pips and the rest of the trade is profit stopped. If it breaks below that support level, the longer- and shorter term daily uptrend lines are near 1.4590. I may lighten shorts some more or reverse, depending on the candles that form on the 15-minute and hourly charts. While the pair looks top-heavy, it’s resisting falling. One hint on the hourly chart—if RSI starts climbing out of oversold and a bullish candle forms, one might consider a long. If I do that I’ll use tight stops.
On the daily chart, momentum still isn’t dropping off as represented by RSI. I’m not sure the upward ride is over but all one can do is buy dips and sell rallies until a direction sorts itself out.
Here’s the hourly chart:

Here's the daily chart:

© Dianne Fecteau, 2009. No part of this material may be reproduced in any form, or referred to in any other publication, without the express written permission of the author.
My purpose in writing this blog is to show you how one trader, me, makes trading decisions and survives while trading Forex. One of the biggest problems I had when I first started trading was trying to apply the “rules” to actual trades. Another was the psychology—limiting losses and letting profits run. If you study my blog you’ll see how I deal with both those issues. So my writings are not trade recommendations but rather educational in purpose. You have to decide on your own approach to trading. Remember that trading is risky.
AUDUSD—Topping? Re-grouping?
Yesterday’s trade, bought Friday at .9242 was profit stopped at .9322 for 80 pips. I also took some partial profits at .9370 for 128 pips.
This pair is rising and falling within a range of .9211 to .9406, its high yesterday. It’s either topping or trying to find the energy for another push upward. The long-term trend line from March (in red on the chart below) is coming in at .9055. A dip to that would be a buy point, given the overall uptrend and the bullish outlook for commodities. Although, as far as commodity prices go, can anyone spell b-u-b-b-l-e? Gold bullion bars going like hot cakes at Harrods in London; new gold traders opening long positions. By the way, what, exactly, does the doom-and-gloom crowd think we’re going to do with gold if the USD collapses? Do they believe the local Safeway or Publix is set up to start weighing little gold nuggets? Or that you can buy your Big Gulp at 7-Eleven with a sprinkle of gold dust? Not to sound like a right-wing, gun-toting, drill baby drill, nut case but if collapse is really coming, guns will be more relevant than gold. At least you could shoot a squirrel for supper. But I digress.
On the 3-hour chart, the pair has formed a hammer. In order for this to be valid the next candle cannot close below the hammer’s low. This scenario is unfolding on the one-hour chart as well so traders don’t have to wait on the three-hour. Price action as it approaches the trend line it recently broke will also be important to watch. So, bottom line, one could buy at the close of the next hourly candle, a touch of the range low at .9211, a touch of the long-term daily uptrend at .9055, or a regaining of the broken trend line depending on what price action looks like at that time. Regardless, I’d watch for signs of topping if it climbs towards yesterday’s highs and either lighten longs or attempt a short.

© Dianne Fecteau, 2009. No part of this material may be reproduced in any form, or referred to in any other publication, without the express written permission of the author.
My purpose in writing this blog is to show you how one trader, me, makes trading decisions and survives while trading Forex. One of the biggest problems I had when I first started trading was trying to apply the “rules” to actual trades. Another was the psychology—limiting losses and letting profits run. If you study my blog you’ll see how I deal with both those issues. So my writings are not trade recommendations but rather educational in purpose. You have to decide on your own approach to trading. Remember that trading is risky.
USDCAD—Chop-chop-chopping along
Yesterday, I wrote that I went long at 1.0473. I was stopped out at 1.0445 for a loss of 28 pips. I entered a long at 1.0433 which profit stopped out at 1.0443 on a dip. Undeterred, I tried another long at 1.0453. As of 6:15 AM EST it’s up 123 pips. I took some partial profits off the table at 120 pips this morning. Two questions probably arise from this little tale.
1) Why did I keep going long?
2) Is this pair really going anywhere?
The answer to the first is, in part, because of the close analysis I have been doing on this pair. I have spent hours tracking it, calculating various zones of support and resistance, and using a number of approaches that, if I wrote about them all, would have this blog too wordy to read by anyone but those with no life whatsoever. My belief is the pair is basing. However, that’s just opinion. I will happily throw it out if I find sufficient evidence otherwise. So far I haven’t.
Think for a moment about what basing means in terms of behavior. It’s trying to find a bottom and it’s chop-chop-chopping along while it does so. So far the bottom is in at 1.0208. It’s not re-approaching that level, despite the dips. When basing, a pair is reversing trend. This is a slow process; the longer it goes on, the better it is for eventual recovery. Each time this pair dips, buyers are coming in at higher levels than before. So the pair climbs. Then some buyers get nervous and decide to take quick profits. The pair drops. But new buyers come in. They’re becoming aware of movement. And they want to grab some pips. This is our little drama that’s played out every day in the markets. Price moves up; price moves down while it’s seeking out a direction. This is what basing feels like.
Getting back to the first question—why did I keep going long—the answer is found in this reasoning. If basing means ups and downs then I’m going to buy the downs. That means I look for reasonable entry points so the stop, if it gets hit, doesn’t bother me too much. Yes, all losses stink. Unfortunately, you can’t trade without them. But I can keep them relatively small.
On the three hour chart, the pair held a price that was also polarity. I found this encouraging. I bought again. I still was stopped but I had already moved my stop to above breakeven. Because it reversed again, just about the point it stopped me out (how often does that happen, kiddos?), I bought again. There’s also divergence between price and RSI. Before I left my desk yesterday, I moved my stop to just above breakeven. This allowed me to sleep well. This morning, voila, up 120 pips. The market rewarded my persistence because the market is what gave me the clues that led to my being persistent.
For the second question—is the pair really going anywhere—the true answer is who the heck knows. Yes, there are those who will tell you absolutely yes or absolutely not because the cycle is blah-blah or the Elliott Wave count is such and such. Those are clues—they’re not definitive answers. All we should do as traders is gather our evidence (which must consist of more than one clue or theory) and decide what amount of loss you can live with. Then find your entry and make your trade.
Here are the general clues I’m working with:
1) I still see the pair as in uptrend from its 2007 low.
2) Weekly closes have held well above the recent low of 1.0208
3) There’s serious support (based on my calculations) in the 1.0325/50/75 range
4) One can argue an EW count that supports an upward movement
In addition, even if it’s not basing at all—it’s in some sort of minor correction before fulfilling the doom and gloom crowd’s belief that the USD will be worth nada in the coming months, it has slowed its rate of descent and some chop-chop is definitely taking place. This means pips are available for the taking. Can anything change my mind it’s basing? I’ve said so repeatedly. I work very hard at not getting attached to my beliefs.
Here’s the three-hour chart:

© Dianne Fecteau, 2009. No part of this material may be reproduced in any form, or referred to in any other publication, without the express written permission of the author.
My purpose in writing this blog is to show you how one trader, me, makes trading decisions and survives while trading Forex. One of the biggest problems I had when I first started trading was trying to apply the “rules” to actual trades. Another was the psychology—limiting losses and letting profits run. If you study my blog you’ll see how I deal with both those issues. So my writings are not trade recommendations but rather educational in purpose. You have to decide on your own approach to trading. Remember that trading is risky.
Monday, November 16, 2009
USDCAD--Is it basing or what?
This pair is fun, isn’t it? Up, down, correcting, basing?
First, on the trade where I took partial profits last week at 122 pips, the remainder of the trade profit stopped out at 60 pips (1.0492). Now the question is what, if anything, to do next. Nothing is a valid choice in trading. As the saying goes, you can’t lose money if you’re out of the market. True, true, but you can’t make money either. The key is to have solid reasons for getting in. Studying the chart tells you if you do.
On the weekly chart, the pair closed lower than last week. The high close was two weeks ago at 1.0848. From this one clue, one could speculate that the pair might have peaked and is resuming its downtrend. RSI on the weekly is not oversold. Another way to look at it on the weekly chart is to see it as in an uptrend from its low in 2007 of .9058. The second touch of that trend line would have been 1.0208 three weeks ago. The trend line is currently coming in at 1.0376 which happens to coincide with a level I identified a couple of weeks ago as providing support since it was a Fibonacci confluence area. Looking back on the weekly chart one also sees polarity in the 1.0325/90 area. Even though the pair dipped to 1.0208, it has not had a weekly close below 1.0370. So this is an interesting area and, so far, it’s staying well above it, not dropping lower than 1.0417. However, it previously broke a long term uptrend line in May and again in July.
The last few weekly candles don’t have upper shadows for the most part.
I dropped my original Elliott Wave (EW) count on the weekly chart since the recent lows have dipped into what would be wave one’s territory. While there is little EW theorists can agree about, one of the three inviolate rules is that wave four cannot do this. So I’ve crossed through those numbers and set the top of wave one at March’s high of 1.3065. If that is true (big if), then we’re in a wave two correction that could have completed or is wave A of a zigzag. Next move would be up, either way.
Bottom line, the weekly chart is mixed. Here’s the weekly chart:

On the daily chart and staying with EW, it could be in wave two (must stay above 1.0208) or in wave B of an ABC correction, possibly a zigzag. The pair broke above the downtrend line. The RSI is staying above oversold. The candle prior to the last completed one is a bullish engulfing. The rate of descent has definitely slowed. And yes, I went long at 1.0473. I feel OK about his because I’ve been tracking the pair so closely and I’ve taken so many profits off the table. But I could not heartily recommend this action for most people since the strength of bearish sentiment is strong on the USD and we still don’t have enough information to say the trend has reversed. Here’s the daily chart:

© Dianne Fecteau, 2009. No part of this material may be reproduced in any form, or referred to in any other publication, without the express written permission of the author.
My purpose in writing this blog is to show you how one trader, me, makes trading decisions and survives while trading Forex. One of the biggest problems I had when I first started trading was trying to apply the “rules” to actual trades. Another was the psychology—limiting losses and letting profits run. If you study my blog you’ll see how I deal with both those issues. So my writings are not trade recommendations but rather educational in purpose. You have to decide on your own approach to trading. Remember that trading is risky.
AUDUSD--Hesitating
As I blogged on Friday, I bought two positions in AUDUSD on Thursday’s dip. One hit its profit target at 9313 for 63 pips profit. The other, bought at .9242 is still open and is profit stopped at 50 pips.
The pair is still in an overall uptrend, yes, but it’s going through one of its periodic, “I don’t know if I can make it,” stages. Last week its high was .9370; so far it has had several candles reach .9353 on the hourly chart before falling back. It has dropped back to the short term trend line on the three- and one-hour chart. (RSI has already broken its uptrend line) The trend line needs to hold at .9315, the price that is also the floor of what will be the double top (on the three-hour chart) if it breaks. But there’s not a lot of downside based on the calculated profit target from this. The daily trend line comes in at .9040. Here’s the one hour chart:

© Dianne Fecteau, 2009. No part of this material may be reproduced in any form, or referred to in any other publication, without the express written permission of the author.
My purpose in writing this blog is to show you how one trader, me, makes trading decisions and survives while trading Forex. One of the biggest problems I had when I first started trading was trying to apply the “rules” to actual trades. Another was the psychology—limiting losses and letting profits run. If you study my blog you’ll see how I deal with both those issues. So my writings are not trade recommendations but rather educational in purpose. You have to decide on your own approach to trading. Remember that trading is risky.
Subscribe to:
Posts (Atom)