Friday, July 30, 2010
Thursday, July 29, 2010
USDCAD—nearing bottom of coil
USDCAD is still coiling within its daily triangle. Its low this morning (so far) has been 1.0304, getting near to the upward line at 1.0279. I may put in a buy order near there as the stop can be fairly tight. However, it’s worth remembering the pair is being capped by a Fib confluence zone at 1.0399 as well as a round number.
I’ve posted the chart enough that shows the coil so won’t post again.
© Dianne Fecteau, 2010. No part of this material may be reproduced in any form, or referred to in any other publication, without the express written permission of the author.
My purpose in writing this blog is to show you how one trader, me, makes trading decisions and survives while trading Forex. One of the biggest problems I had when I first started trading was trying to apply the “rules” to actual trades. Another was the psychology—limiting losses and letting profits run. If you study my blog, you’ll see how I deal with both those issues. So my writings are not trade recommendations but rather educational in purpose. You have to decide on your own approach to trading. Remember that trading is risky.
USDCHF—nearing support
USCHF is again dropping down to the 1.0400/1.0395 lows for what will either be a third test of this support level (on the three-hour chart) or a mere point to pause before further lows. The move down on the hourly chart is brisk. I may place a small buy order for that point since I need to be leave soon to go to my first meeting. Tight stops are imperative. Even if the pair bounces from 1.04, there’s not much significance to its moves until it overcomes the tough resistance from 1.0560 to 1.0675. This may have to be sideways trade for the time being as it has been since earlier in July. On the three-hour chart this move looks corrective during a downtrend which hints more lows may be coming. As my longer term analyis has shown, however, the pair is still in an overall uptrend.
Support is at 1.0400/395, 1.0368, and 1.0228/17. Resistance is at 1.0550/60, 1.0603, 1.0640, and 1.0676. Only if it breaks out of this resistance zone is it worth posting higher levels.
Here’s the three hour chart:

© Dianne Fecteau, 2010. No part of this material may be reproduced in any form, or referred to in any other publication, without the express written permission of the author.
My purpose in writing this blog is to show you how one trader, me, makes trading decisions and survives while trading Forex. One of the biggest problems I had when I first started trading was trying to apply the “rules” to actual trades. Another was the psychology—limiting losses and letting profits run. If you study my blog, you’ll see how I deal with both those issues. So my writings are not trade recommendations but rather educational in purpose. You have to decide on your own approach to trading. Remember that trading is risky.
AUDUSD—Near 200 SMA
After it dropped to a low of .8906 yesterday, the pair turned upward again reaching a high of .9038 so far this morning. On the daily chart it’s hovering around its 200 SMA, currently .8957, and it’s not yet oversold. I think there is more upward movement possible and if I was actively trading this week would look for an entry based on pullback on the shorter-term charts (i.e. 1-hour or perhaps even 30-minute). The only cause for concern is that overall momentum is not as positive as one would hope to see in a robust uptrend. Which probably means it’s not all that robust but then what is these days?
Resistance is at .9069, .9100, .9157, .9200 and .9353. Support is at .8957 (200 DSMA) .8923/06, .8896, .8859, and .8738.
Here’s the daily chart. The daily chart can be best understood in the context of the weekly analysis I blogged about yesterday.

© Dianne Fecteau, 2010. No part of this material may be reproduced in any form, or referred to in any other publication, without the express written permission of the author.
My purpose in writing this blog is to show you how one trader, me, makes trading decisions and survives while trading Forex. One of the biggest problems I had when I first started trading was trying to apply the “rules” to actual trades. Another was the psychology—limiting losses and letting profits run. If you study my blog, you’ll see how I deal with both those issues. So my writings are not trade recommendations but rather educational in purpose. You have to decide on your own approach to trading. Remember that trading is risky.
EURUSD—Getting near tough resistance
The Euro finally got moving after spending some time consolidating yesterday. It went without me as my buy order wasn’t hit. The high so far this morning has been 1.3092.
There are a few price targets to keep in mind. If this in fact is an Elliott Wave ABC correction from the 1.1876 low, then 1.618 the length of A would bring price to 1.3108. That’s also close to the .382 retracement of the move down from last November. We’re very close and if this isn’t the end of wave C expect expect some faltering as sellers come in. Occasionally, Wave C is 2.168 times that of A (convenient isn’t it how the theory expands to accommodate price action) and that would bring it to 1.3433. As I wrote a week or so ago when I discussed price targets, that also brings it into line with the inverted head and shoulders price target. So there is still possibility for movement in both directions. If you’re bearish, you’d try a short near the 1.3108/40 area with a tight stop. I’d want to see momentum on the short-term charts before doing so and since I’m at my conference again today I may not get a chance to do so. There is some negative divergence on the three-hour chart but this is typical during the end of moves.
If the pair robustly achieves and clears 1.3150, I think there is a possibility for the 1.34 area. It’s also worth noting that the most recently closed three-hour candle (8 AM EST) broke above a speed line. One could buy a pullback to 1.3050 but the stop would have to be fairly wide (below 1.2950).
I hate to be a pill but if you look at a daily chart (not shown), you could make an argument for being in an overall impulsive wave at this point. I’m not trading with that in mind but it’s something to be aware of—some people are.
Support is at 1.3050, 1.2950/30, 1.2875, 1.2840, 1.2794, 1.2733, 1.2683 and 1.2523. Resistance is at 1.3108, 1.3150, 1.3240, 1.3300, and 1.3430.
Here’s a three-hour chart:

© Dianne Fecteau, 2010. No part of this material may be reproduced in any form, or referred to in any other publication, without the express written permission of the author.
My purpose in writing this blog is to show you how one trader, me, makes trading decisions and survives while trading Forex. One of the biggest problems I had when I first started trading was trying to apply the “rules” to actual trades. Another was the psychology—limiting losses and letting profits run. If you study my blog, you’ll see how I deal with both those issues. So my writings are not trade recommendations but rather educational in purpose. You have to decide on your own approach to trading. Remember that trading is risky.
Wednesday, July 28, 2010
USDCAD—coiling
USDCAD is still coiling within its daily triangle. Yesterday it dropped to 1.0257, the bottom, and is hovering just above there (currently offered at 1.0347) with a Fib confluence zone at 1.0399 just above. RSI has dipped slightly below its uptrend line. 1.0569 is the top line of the triangle and if it heads back there it will encounter additional resistance from a Fib confluence zone at 1.0581.
Here’s the daily chart:

© Dianne Fecteau, 2010. No part of this material may be reproduced in any form, or referred to in any other publication, without the express written permission of the author.
My purpose in writing this blog is to show you how one trader, me, makes trading decisions and survives while trading Forex. One of the biggest problems I had when I first started trading was trying to apply the “rules” to actual trades. Another was the psychology—limiting losses and letting profits run. If you study my blog, you’ll see how I deal with both those issues. So my writings are not trade recommendations but rather educational in purpose. You have to decide on your own approach to trading. Remember that trading is risky.
USDCHF—struggling
My long trade from yesterday stopped at breakeven. The pair just dipped to a low of 1.0552 which is below the doji low of 1.0560 from yesterday morning. Below 1.0560, there’s additional support at 1.0530, 1.0461, 1.0408, 1.0394 and 1.0368. I suspect that there may be another move down before the pair turns up again. The pair has broken below its RSI uptrend line and the next thing to watch for is whether it breaks a price uptrend line. Should it head up, there’s obviously significant resistance from 1.0603 to 1.0676 to overcome.
Here’s the hourly chart:

© Dianne Fecteau, 2010. No part of this material may be reproduced in any form, or referred to in any other publication, without the express written permission of the author.
My purpose in writing this blog is to show you how one trader, me, makes trading decisions and survives while trading Forex. One of the biggest problems I had when I first started trading was trying to apply the “rules” to actual trades. Another was the psychology—limiting losses and letting profits run. If you study my blog, you’ll see how I deal with both those issues. So my writings are not trade recommendations but rather educational in purpose. You have to decide on your own approach to trading. Remember that trading is risky.
EURUSD—Can it break above 1.3050?
The Euro has so far been unable to make new grounds, struggling with the 1.3050 cap. It may break above this but if it does, sellers are likely going to enter at 1.3108/50 (Elliott calculation and bull flag target) and 1.3200. What about the inverted head and shoulders that was confirmed? I’ve consistently maintained that until the pair gets above 1.32 it’s not worth discussing. However that price target is still in play at around 1.34. So, let’s see if the pair can overcome its inertia and get moving. If the pair broke the short term hourly trendline at 1.2930 it’s cause for concern but note the layers of support immediately beneath there.
As I’ve said, I’m not trading much this week because of being at a conference but I may try a buy order at one of the support levels, possibly 1.2950. Short-term momentum is still good.
Support is at 1.2950/30, 1.2875, 1.2844/30, 1.2794, 1.2733 and 1.2683. Resistance is at 1.3050, 1.3108, 1.3150, and 1.3200.
Here’s a one-hour chart:

© Dianne Fecteau, 2010. No part of this material may be reproduced in any form, or referred to in any other publication, without the express written permission of the author.
My purpose in writing this blog is to show you how one trader, me, makes trading decisions and survives while trading Forex. One of the biggest problems I had when I first started trading was trying to apply the “rules” to actual trades. Another was the psychology—limiting losses and letting profits run. If you study my blog, you’ll see how I deal with both those issues. So my writings are not trade recommendations but rather educational in purpose. You have to decide on your own approach to trading. Remember that trading is risky.
AUDUSD—weekly
Since being above .9000 this week (yesterday’s high was .9069), the pair has broken several price targets. It ran into other resistance (May highs, etc) so the fall back to.8923 (nice little short trade right there but since I’m at a conference this week I haven’t been trading much) was not unexpected.
Now what? Will the next price be the .9364 resistance from April? It’s possible. Looking at the weekly chart, one could make the case that the pair has completed an ABC correction and is in a fifth wave up. I’ve labeled this in blue numbers and letters on the weekly chart below. This could be part of an overall second wave correction or just the pair resuming its uptrend. Using red letters I’ve labeled what could be a second wave correction which had the C wave topping at the last high. That would place us at the beginning of a third wave down with a correction currently taking place. That correction could extend up to .9350 or so. Given that the weekly downtrend line is coming in at .9340, this means there is still be a long trade possible.
On my three hour point and figure chart I have a price target remaining of .9450 and the chart is showing that the last buy signal (at .8880) is progressing nicely.
On the three-hour chart (not shown), the pair looks as though it’s trying to base at .8923 although a drop back to the July 22/23 lows of .8896 wouldn’t be a surprise. I’m not inclined to trade right now since I can’t watch the charts closely but I’d probably try a small long at that level with a very tight stop. If it approaches .9069 again, a short might be possible depending on momentum.
Resistance is at .9069, .9100, .9157, .9200 and .9353. Support is at .8923, .8896, .8859, and .8738.
All in all a very interesting pair right now. Here’s the weekly chart:

© Dianne Fecteau, 2010. No part of this material may be reproduced in any form, or referred to in any other publication, without the express written permission of the author.
My purpose in writing this blog is to show you how one trader, me, makes trading decisions and survives while trading Forex. One of the biggest problems I had when I first started trading was trying to apply the “rules” to actual trades. Another was the psychology—limiting losses and letting profits run. If you study my blog, you’ll see how I deal with both those issues. So my writings are not trade recommendations but rather educational in purpose. You have to decide on your own approach to trading. Remember that trading is risky.
Tuesday, July 27, 2010
USDCHF—update
I forgot to mention in my last post that I went long again at 1.0594. It shows on the chart I posted.
USDCHF—broke out of range
In a teeth-gnashing move, the market profit-stopped me out at 1.0464 yesterday (+50 pips) and then turned around and marched upward to a high of 1.0603 early this morning before falling back to 1.0560. I wasn’t at my computer trading yesterday (and won’t be much of this week) since I’m at a conference. Had I been trading I would have jumped back into the trade. OK, those things happen and it’s hardly the last chance I’ll get to trade. It’s still annoying.
The hourly chart shows a just completed doji with a low of 1.0560 so that is nearby support. If that holds, we may see another push up but note that the pair is overbought on the hourly. The thing that’s of interest though is that the pair broke above the range I wrote about yesterday (1.0394 to 1.0564) and just came back to test the top of the range so it seems possible it’s on a roll.
Below 1.0560, there’s additional support at 1.0461, 1.0408, 1.0394 and 1.0368. There’s significant resistance from 1.0603 to 1.0676 so the pair is going to have to get through that.
Here’s the hourly chart:

© Dianne Fecteau, 2010. No part of this material may be reproduced in any form, or referred to in any other publication, without the express written permission of the author.
My purpose in writing this blog is to show you how one trader, me, makes trading decisions and survives while trading Forex. One of the biggest problems I had when I first started trading was trying to apply the “rules” to actual trades. Another was the psychology—limiting losses and letting profits run. If you study my blog, you’ll see how I deal with both those issues. So my writings are not trade recommendations but rather educational in purpose. You have to decide on your own approach to trading. Remember that trading is risky.
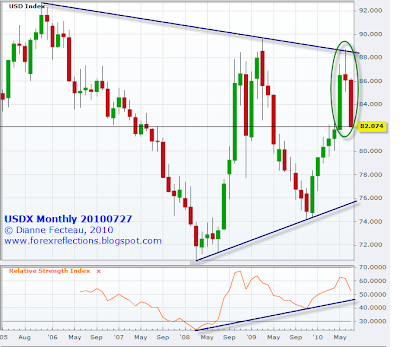
USD Index—Monthly
Yesterday saw another low for the buck. A look at the monthly chart provides some interesting insights.
First, note what seems to be the pronounced evening star (I circled it) currently forming. We won’t know for sure until the month is finished but this kind of three-candle formation after an uptrend is bearish. Since it’s occurring at resistance, it could mean there is further down potential for the dollar. Second, the pair is coiling within a symmetrical triangle and it’s not unreasonable to think it may be headed to the bottom of the triangle which would be about 75.42. (That would give the gold-hoarding doom and gloomers something to hop up and down about.)
One could also make the case for an ABC correction. I don’t think that’s as likely but one might as well look at the possibilities. The reason I don’t think it’s likely is that the retracement was 82% of the move from the 2005 high of 92.63 to the 70.70 low and that’s a pretty steep retracement. One wouldn’t expect to see that if the underlying trend was strong. It makes more sense to see it as having completed wave one and two and beginning wave three.
Another thing that’s encouraging on this chart is the RSI. It’s maintaining a nice upward line and at the Nov. 2009 dip stayed above 40. That doesn’t sound very bearish.
Finally, it’s at support now with polarity and price support and it’s close to a Fib confluence area at 81.66. There’s additional support down to 79.50.
So what to conclude from all this for a longer term bias? Given the potential EW third wave, the RSI, and the current and nearby support levels, I have a positive bias. That evening star is gruesome and the symmetrical triangle is compelling however, so I’m not sure I’d jump into long positions at the moment. What it really says is that I need to now drop down and analyze shorter term charts.
Here’s the monthly chart:
© Dianne Fecteau, 2010. No part of this material may be reproduced in any form, or referred to in any other publication, without the express written permission of the author.
My purpose in writing this blog is to show you how one trader, me, makes trading decisions and survives while trading Forex. One of the biggest problems I had when I first started trading was trying to apply the “rules” to actual trades. Another was the psychology—limiting losses and letting profits run. If you study my blog, you’ll see how I deal with both those issues. So my writings are not trade recommendations but rather educational in purpose. You have to decide on your own approach to trading. Remember that trading is risky.
First, note what seems to be the pronounced evening star (I circled it) currently forming. We won’t know for sure until the month is finished but this kind of three-candle formation after an uptrend is bearish. Since it’s occurring at resistance, it could mean there is further down potential for the dollar. Second, the pair is coiling within a symmetrical triangle and it’s not unreasonable to think it may be headed to the bottom of the triangle which would be about 75.42. (That would give the gold-hoarding doom and gloomers something to hop up and down about.)
One could also make the case for an ABC correction. I don’t think that’s as likely but one might as well look at the possibilities. The reason I don’t think it’s likely is that the retracement was 82% of the move from the 2005 high of 92.63 to the 70.70 low and that’s a pretty steep retracement. One wouldn’t expect to see that if the underlying trend was strong. It makes more sense to see it as having completed wave one and two and beginning wave three.
Another thing that’s encouraging on this chart is the RSI. It’s maintaining a nice upward line and at the Nov. 2009 dip stayed above 40. That doesn’t sound very bearish.
Finally, it’s at support now with polarity and price support and it’s close to a Fib confluence area at 81.66. There’s additional support down to 79.50.
So what to conclude from all this for a longer term bias? Given the potential EW third wave, the RSI, and the current and nearby support levels, I have a positive bias. That evening star is gruesome and the symmetrical triangle is compelling however, so I’m not sure I’d jump into long positions at the moment. What it really says is that I need to now drop down and analyze shorter term charts.
Here’s the monthly chart:

© Dianne Fecteau, 2010. No part of this material may be reproduced in any form, or referred to in any other publication, without the express written permission of the author.
My purpose in writing this blog is to show you how one trader, me, makes trading decisions and survives while trading Forex. One of the biggest problems I had when I first started trading was trying to apply the “rules” to actual trades. Another was the psychology—limiting losses and letting profits run. If you study my blog, you’ll see how I deal with both those issues. So my writings are not trade recommendations but rather educational in purpose. You have to decide on your own approach to trading. Remember that trading is risky.
Monday, July 26, 2010
EURUSD—same old, same old
There’s not a lot to say about the Euro that I haven’t already said last week or so. It’s in a raggedy type of correction, probably an Elliott Wave C wave. Until it gets above 1.3108 (the .618 retracement of the 1.3818 to 1.1876 down move and 1.618 the length of wave A, as well as a price target from an old bull flag, one can hardly make a case it’s in a sustainable uptrend.
The range last week was 1.2733 to 1.3028. Euro is currently offered at 1.2945, about the 75% point of that range. I plan on either shorting up around 1.30 or buying down near the bottom. This point here is no man’s land.
© Dianne Fecteau, 2010. No part of this material may be reproduced in any form, or referred to in any other publication, without the express written permission of the author.
My purpose in writing this blog is to show you how one trader, me, makes trading decisions and survives while trading Forex. One of the biggest problems I had when I first started trading was trying to apply the “rules” to actual trades. Another was the psychology—limiting losses and letting profits run. If you study my blog, you’ll see how I deal with both those issues. So my writings are not trade recommendations but rather educational in purpose. You have to decide on your own approach to trading. Remember that trading is risky.
GBPUSD—Weekly Chart
Cable tested the 20 EMA last week and it held as support. Currently the 20 EMA is at 1.5158. Offsetting this bit of happy news is that it is nudging a downtrend line from late 2009 and is also encountering resistance set by the April highs in the 1.5522 region. 1.5559 is also the daily 200 SMA. On the downside, there’s an uptrend line coming in from early 2009 at 1.4364. If the pair bounces between these two points one could get off some nice trades in the near term, depending on price behavior on the shorter term charts.
Here’s the weekly chart:

© Dianne Fecteau, 2010. No part of this material may be reproduced in any form, or referred to in any other publication, without the express written permission of the author.
My purpose in writing this blog is to show you how one trader, me, makes trading decisions and survives while trading Forex. One of the biggest problems I had when I first started trading was trying to apply the “rules” to actual trades. Another was the psychology—limiting losses and letting profits run. If you study my blog, you’ll see how I deal with both those issues. So my writings are not trade recommendations but rather educational in purpose. You have to decide on your own approach to trading. Remember that trading is risky.
USDCAD—Weekly Chart
On the weekly chart the symmetrical coil I wrote about last week appears somewhat less significant but also less reassuring to the USD bulls since it occurred during a downtrend and these patterns are often continuation moves. However they don’t have to be.
There are various ways to trade the break from a triangle. One way is if it breaks, get on board. A more conservative approach is to watch it break, wait for it to return and retest and then move again. If it moves a second time in the same direction one can place the trade. A third way of course is to be contrary and assume a move up to the other line in the triangle, regardless of any break below or above the nearby line. I like this approach better when it’s not so near the apex of the triangle but it can still be workable. The point is that however you trade it the triangle line offers an opportunity for a tight stop, especially if you can combine that line with other key support or resistance.
The roughly 1.0264 of the lower weekly line does correlate with other support and resistance in the 1.0250 to 1.0350 range. If it breaks below this line then the uptrend line in red is coming in at 1.0040. The upper line of the triangle is at 1.0588, right on a fib confluence zone so it adds to the resistance. If price breaks upward it would be encouraging to USD bulls. Additional resistance is at 1.0677 and of course the 1.0855 price.
Momentum on the weekly chart (as represented by RSI) is generally encouraging as it hasn’t become oversold. I’m continuing to watch this pair closely.
Here’s the weekly chart:

© Dianne Fecteau, 2010. No part of this material may be reproduced in any form, or referred to in any other publication, without the express written permission of the author.
My purpose in writing this blog is to show you how one trader, me, makes trading decisions and survives while trading Forex. One of the biggest problems I had when I first started trading was trying to apply the “rules” to actual trades. Another was the psychology—limiting losses and letting profits run. If you study my blog, you’ll see how I deal with both those issues. So my writings are not trade recommendations but rather educational in purpose. You have to decide on your own approach to trading. Remember that trading is risky.
USDCHF—Weekly Chart
While all the chatter this morning is about how the Swissy has slipped below 1.0500 and is therefore in a lot of trouble, the more interesting picture to me is the weekly chart because you can see that until the pair slips below parity it hasn’t done much of interest at all. At that point it will have slipped below its symmetrical triangle. The upside of that triangle is 1.1660 and a break above that would also be interesting as in the bears would be howling then. The potential price targets, up and down, of a break of this triangle are healthy to the tune of 2,663 pips. The other thing noable on the weekly chart is the two shadows below the last two weekly candles. The pair looks as though it’s trying to base. Let’s see if it can make it.
For the last seven days the pair has been in a fairly narrow range of 170 pips (1.0394 to 1.0564). I’d like to see it get out of this range this week but we’ll have to see. Meanwhile, my long from 1.0414 is profit-stopped and I took some partial profits this morning at +90 pips.
Nearby support is at 1.0408, 1.0394 and 1.0368. Resistance is at 1.0564, 1.0581, and 1.0639. As I wrote on Friday, the 1.0502 to 1.0546 and 1.06 price zones are significant resistance with fib confluence, polarity, and moving averages.
Here’s the weekly chart. My trade doesn’t show on the weekly charts because I use a different charting package for longer term charting.

© Dianne Fecteau, 2010. No part of this material may be reproduced in any form, or referred to in any other publication, without the express written permission of the author.
My purpose in writing this blog is to show you how one trader, me, makes trading decisions and survives while trading Forex. One of the biggest problems I had when I first started trading was trying to apply the “rules” to actual trades. Another was the psychology—limiting losses and letting profits run. If you study my blog, you’ll see how I deal with both those issues. So my writings are not trade recommendations but rather educational in purpose. You have to decide on your own approach to trading. Remember that trading is risky.
Subscribe to:
Posts (Atom)