Friday, January 29, 2010

EURUSD—resistance levels

EURUSD—resistance levels

The Euro has bounced a bit which I expected when I wrote late yesterday that I was taking profits. I still have part of a short on from 1.4074.

The pair fell to a low of 1.3912 last evening. Today it touched 1.3987 before falling back. I am looking to short again but it needs to reach an attractive level before I do so. The resistance levels of interest are:

1.4000 (round number, prior support, and a short-term downtrend line)
1.4028/52 (Jan 28 highs and prior resistance)
1.4085/87 (prior resistance)
1.4150/70/94 (prior resistance and Monday highs)

That’s quite a wide range which means each level must be assessed individually or you need to set wide stops. I may try a small short at 1.40. The candles on the hourly chart look indecisive so it may not make it.

Support is at 139.12/22/42 (last night and today’s lows and 1.3914/19 is polarity), 1.3888 (calculated target), and 1.3800 (round number and support). Below 1.38, there are additional calculated targets based on the daily bear flag and other characteristics but there’s no need to think about them right now.

Here’s the hourly chart:


© Dianne Fecteau, 2010. No part of this material may be reproduced in any form, or referred to in any other publication, without the express written permission of the author.

My purpose in writing this blog is to show you how one trader, me, makes trading decisions and survives while trading Forex. One of the biggest problems I had when I first started trading was trying to apply the “rules” to actual trades. Another was the psychology—limiting losses and letting profits run. If you study my blog, you’ll see how I deal with both those issues. So my writings are not trade recommendations but rather educational in purpose. You have to decide on your own approach to trading. Remember that trading is risky.

USDJPY—potential short

Monday I wrote that I bought this pair for 90.25 based on what looked like a pennant on the daily chart. The pair continued down to a low of .8918 and I was stopped out on the way down (-70 pips reported on Tuesday). This biased me against the pair. I wanted to short but I couldn’t find a clear signal (based on the characteristics I look for before entering a trade). In all the ensuing market action, I put the pair on the back burner. This morning when analyzing yen crosses, I analyzed it again.

After bottoming at 89.18, USDJPY climbed, reaching a high of 90.55 yesterday before falling back a bit. Still no clear signals for me to enter but there are some interesting things going on in the pair.

A look at the weekly chart shows what could become an inverted head and shoulder (H&S) pattern. This is unconfirmed until the pair crosses the neckline (93.79, too far away for most short-term traders to worry about). On the three-hour chart, one could also make out a potential H&S and the neckline is much closer at 90.55. The problem with this is that the downtrend line of my pennant is coming in at 90.75. There is also polarity coming in at 90.71 (from the daily chart). Finally, 90.81 is the .618 retracement from the January 21 high of 91.87. The three of these together, in addition to the pair being in an overall downtrend and the fact that the current moves look corrective to me, should make for some significant resistance so I may look for another short as it approaches that price. Tight stops would be critical both because of the potential for breaking upward from the pennant on the daily chart and the potential inverted H&S on the weekly chart. Should it break above that resistance, I’d expect a climb back to the earlier highs of 91.87.

Here is the three-hour chart:


Here is the weekly chart with the potential H&S marked:


© Dianne Fecteau, 2010. No part of this material may be reproduced in any form, or referred to in any other publication, without the express written permission of the author.

My purpose in writing this blog is to show you how one trader, me, makes trading decisions and survives while trading Forex. One of the biggest problems I had when I first started trading was trying to apply the “rules” to actual trades. Another was the psychology—limiting losses and letting profits run. If you study my blog, you’ll see how I deal with both those issues. So my writings are not trade recommendations but rather educational in purpose. You have to decide on your own approach to trading. Remember that trading is risky.

Thursday, January 28, 2010

Euro profits

I just closed my original Euro trade from 1.4325 for +374 pips and took partial profit on the second one for + 103 pips. The pair failed to follow through and a bounce may be coming. Besides I like being flat at the end of the month so I'm starting to unwind.

Yeah, baby

Took +90 pips off the table from the GBPUSD trade and Euro might indeed be falling to 1.3888. Logic says, though, that the bulls are getting ready to fight back.

USDCAD—still fighting resistance

When last I checked, the pair was battling resistance and now that I’ve checked again the pair is, ta-dah, battling resistance. My long position from 1.0256 is up 331 pips as I write (8:16 AM EST) after a dip to a low of 1.0557. The high so far this week has been 1.0692. I took a bit more in partial profits yesterday at +400 pips.

The pullback is welcome (definitely a bullish statement on my part since only someone bullish on the pair could characterize a pullback as welcome). However, as I wrote the other day, the rate of ascent is still too steep for my taste. There’s some dreary bearish divergence between price and RSI so more reaction may be coming.

Support is at 1.0557, 1.0525/34, and 1.0475. Resistance is at 1.0692, 1.0700, 1.0747/50, 1.0779, and 1.0853.

Here’s the three-hour chart:


© Dianne Fecteau, 2010. No part of this material may be reproduced in any form, or referred to in any other publication, without the express written permission of the author.

My purpose in writing this blog is to show you how one trader, me, makes trading decisions and survives while trading Forex. One of the biggest problems I had when I first started trading was trying to apply the “rules” to actual trades. Another was the psychology—limiting losses and letting profits run. If you study my blog, you’ll see how I deal with both those issues. So my writings are not trade recommendations but rather educational in purpose. You have to decide on your own approach to trading. Remember that trading is risky.

AUDUSD—sluggish

I blogged yesterday that I would probably look for a long position in AUDUSD and I found one at .8949 which was near a January low, a November ’09 low and polarity. How many clues do you need? It hasn’t been a disappointment as it is currently (7:56 AM EST) up 73 pips at .9022. I took some profits at +70 pips, since it’s bumping up against a short-term downtrend line.

.9091 is the next resistance (daily 34 EMA and prior highs and then .9146 but the pair is sluggish as are many pairs this morning. I’m not very optimistic about the pair but there is bullish divergence between price and RSI. Support is at .8994, .8914, and .8735.

Here’s the 3-hour chart:


© Dianne Fecteau, 2010. No part of this material may be reproduced in any form, or referred to in any other publication, without the express written permission of the author.

My purpose in writing this blog is to show you how one trader, me, makes trading decisions and survives while trading Forex. One of the biggest problems I had when I first started trading was trying to apply the “rules” to actual trades. Another was the psychology—limiting losses and letting profits run. If you study my blog, you’ll see how I deal with both those issues. So my writings are not trade recommendations but rather educational in purpose. You have to decide on your own approach to trading. Remember that trading is risky.

GBPUSD—ready for a move?

The remainder of my short from 1.6236 yesterday stopped out a +5 pips overnight in trading that took the pair as high as 1.6276. We won’t have to worry about nose bleeds at that level. The weekly highs to date have been 1.6268/84. However, the pair did manage to crawl above its 200 daily SMA. Bully for it.

On the three-hour chart, the current pattern looks corrective to me within the large, sideways pattern and I wouldn’t be surprised to see a move down to the bottom of that pattern at 1.6094 (the low on Tuesday). This is why I just shorted again at 1.6246. A tight stop is mandatory because the market will tell me soon enough if I’m wrong. If so, I may reverse depending on price action.

Support is at:

1.6214 (200 SMA on daily chart; 1/26 low)
1.6108/28 (recent lows)
1.6070/78 (up trend line from late March 2009; recent low)
1.5914 (polarity)

Resistance is at:

1.6300/1.6400 (round number)
1.6461 (January high)


© Dianne Fecteau, 2010. No part of this material may be reproduced in any form, or referred to in any other publication, without the express written permission of the author.

My purpose in writing this blog is to show you how one trader, me, makes trading decisions and survives while trading Forex. One of the biggest problems I had when I first started trading was trying to apply the “rules” to actual trades. Another was the psychology—limiting losses and letting profits run. If you study my blog, you’ll see how I deal with both those issues. So my writings are not trade recommendations but rather educational in purpose. You have to decide on your own approach to trading. Remember that trading is risky.

EURUSD—give me a break

Dancing about the critical 1.40 level, Euro has dipped its toe to 1.3934 overnight and snatched it back, where it managed a climb to 1.4052 before pulling back to its current 1.4004 (6:50 AM EST). Is it going to be one of those up/down fifty-pip days? Give me a break, preferably to 1.3888.

I have two short positions on the table. (My positions are represented by those little orange triangles on the chart—inverted if it’s a sell and upright if it’s a buy. This is where I’m different than most bloggers. I trade my money in a real account and show you the trade as I write about it). My first short is from 1.4325 (329 pips profit currently) and the second, from yesterday, was taken at 1.4074 (78 pips profit currently). I’ve taken some profits along the way on the first one—obviously both are profit-stopped.

The move below the 50% retracement level I wrote about yesterday (1.4013 found by taking the distance from the four consecutive lows in April 2009 to the November top), as well as the piercing of the 1.40 psychological level, were b-e-a-r-i-s-h. The three-hour chart shows a hammer candle in that dip and if the pair goes below that 1.3934 low, it might indeed touch 1.3888 today. Since I strongly doubt we’ll see the plunge to 1.35 that I think is possible, the next supports are at:

1.3934 (overnight low)
1.3914/19 (polarity)
1.3888
1.3800 (round number and support)

Targets continue past there down to 129.00 but let’s not think about those this minute.

Could it recover? Oh sure, and you could begin to argue that case with the bullish divergence that you see on the three-hour chart. It’s important to remember that pairs don’t fall straight down without rallies along the way, but if this is the wave three I’ve been blogging about, the fall will be steep and the rallies will be weak. Resistance is at:

1.4052 (today’s high so far)
1.4085/87
1.4150/70/94
1.4211

Here’s the three-hour chart:


© Dianne Fecteau, 2010. No part of this material may be reproduced in any form, or referred to in any other publication, without the express written permission of the author.

My purpose in writing this blog is to show you how one trader, me, makes trading decisions and survives while trading Forex. One of the biggest problems I had when I first started trading was trying to apply the “rules” to actual trades. Another was the psychology—limiting losses and letting profits run. If you study my blog, you’ll see how I deal with both those issues. So my writings are not trade recommendations but rather educational in purpose. You have to decide on your own approach to trading. Remember that trading is risky.

Wednesday, January 27, 2010

GBPUSD Trade

Now that the hullabaloo has ended for the afternoon, the resistance point for GBPUSD proved to be a good level to short as I wrote earlier this morning. The high this morning was 1.6244 and I shorted at 1.6236. I hope you had a chance to do so as well. I took partial profits at 1.6176 for + 60 pips and my stop is now a profit stop. The pair is currently at 1.6161 (4:37 PM EST) and has started coiling inside a symmetrical triangle. Definitely time to quit for the day but here’s a picture of three-hour chart:


© Dianne Fecteau, 2010. No part of this material may be reproduced in any form, or referred to in any other publication, without the express written permission of the author.

My purpose in writing this blog is to show you how one trader, me, makes trading decisions and survives while trading Forex. One of the biggest problems I had when I first started trading was trying to apply the “rules” to actual trades. Another was the psychology—limiting losses and letting profits run. If you study my blog, you’ll see how I deal with both those issues. So my writings are not trade recommendations but rather educational in purpose. You have to decide on your own approach to trading. Remember that trading is risky.
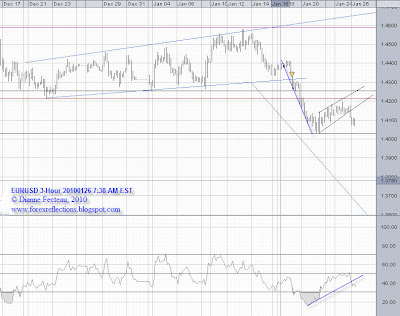
EURUSD—Weaker

Euro is still weakening, dropping to a low of 1.4022 much earlier this morning and approaching it again. It’s currently at 1.4030. I added to my short position on the bounce earlier at 1.4074 and have moved my stop to breakeven. I still have a short position open from 1.4325.

On the three-hour chart, the pair dropped out of another correction on Monday. This bear flag is very much in line with the larger flag that formed on the daily chart. It’s a repetitive drop and rest pattern. If you’re into Elliott Wave (EW) theory, you know a flag is a correction before the next move in the trend direction.

I’m surprised that there hasn’t been a better bounce. Maybe later, in anticipation of what I believe is a non-event but the market doesn’t—the FOMC decision. If the pair closes below the doji’s low (1.4022) on the three-hour chart, things look grim indeed. The pair is also hovering above a 50% retracement from April lows to the November high. The reason I believe April lows are significant is because of the four consecutive days where lows bottomed at 1.2885/99. A break below this 50% level (1.4013), along with the flag targets and confluence zones, could result in seeing 138/139 rather quickly.

Support is at:

1.0422 (today’s low)
1.4013 (50% retracement from April ’09 lows)
1.3973
1.3888
1.3500 (pass the champagne for those with short positions)

Resistance is at:

1.4085/97
1.4111 (yesterday’s high)
1.4150/70
1.4211
1.4315 (daily bear flag line)

Here’s the three-hour chart:


© Dianne Fecteau, 2010. No part of this material may be reproduced in any form, or referred to in any other publication, without the express written permission of the author.

My purpose in writing this blog is to show you how one trader, me, makes trading decisions and survives while trading Forex. One of the biggest problems I had when I first started trading was trying to apply the “rules” to actual trades. Another was the psychology—limiting losses and letting profits run. If you study my blog, you’ll see how I deal with both those issues. So my writings are not trade recommendations but rather educational in purpose. You have to decide on your own approach to trading. Remember that trading is risky.

Narrowing price action

Ranges are getting quite small which is not unusual in advance of the FOMC interest rate decision. I can’t believe anyone really thinks the US will raise interest rates. My oh my, wouldn’t that cause some action if they did?

AUDUSD—daily support and resistance

In contrast to GBPUSD which is at tough resistance, AUDUSD is at good support. This pair hasn’t violated any uptrend lines from early 2009 either, and is far above its 200 SMA (currently at .8522). Yesterday’s daily candle was a doji—this hints at indecision. A close below this doji would be bearish. The pair is currently at .8990 and I may look for a long position. Tight stops are a necessity.

Support lies at:

.8937/38/48—Jan. low to date, yesterday’s doji low, polarity, Nov. ’09 low, today’s low)
.8914 (late March ’09 up trend line and polarity)
.8735 (December low)
.8522 (200 EMA)
.8311 (early March up trend line)

Resistance is at:

.9089 (34 EMA)
.9195 (polarity)
.9322/30 (Dec. ’09 and Jan. 10 highs)
.9406 (Nov. ’09 high)


© Dianne Fecteau, 2010. No part of this material may be reproduced in any form, or referred to in any other publication, without the express written permission of the author.

My purpose in writing this blog is to show you how one trader, me, makes trading decisions and survives while trading Forex. One of the biggest problems I had when I first started trading was trying to apply the “rules” to actual trades. Another was the psychology—limiting losses and letting profits run. If you study my blog, you’ll see how I deal with both those issues. So my writings are not trade recommendations but rather educational in purpose. You have to decide on your own approach to trading. Remember that trading is risky.

GBPUSD—daily support and resistance

GBPUSD is still in an uptrend with intact trend lines from both January and March of 2009 as you can see on the daily chart. This means support lies at those lines. The pair has closed below its 200 SMA (simple moving average, currently at 1.6206) on two of the prior three days but has poked its nose above it this morning. The last few daily candles have upper shadows, hinting at price rejection, but this is not conclusive since the candles are also of a good size.

It’s currently at tough resistance with a convergence of the daily 200 SMA, 34 EMA, polarity, and a round number. One could short here (currently 1.6236) but with tight stops.

Support lies at:

1.6025 (3/09 uptrend line and polarity)
1.5723 (8/09 downtrend line and prior support)
1.4724 (1/09 uptrend line)

Resistance is at:

1.6196/1.6200/1.6206 (round number, 200 SMA, 34 EMA, polarity, 1/10 downtrend line)
1.6200 (round number, polarity)
1.6268/84 (weekly highs to date)
1.6300/6400 (round number)
1.6461 (Jan. 19 high)


© Dianne Fecteau, 2010. No part of this material may be reproduced in any form, or referred to in any other publication, without the express written permission of the author.

My purpose in writing this blog is to show you how one trader, me, makes trading decisions and survives while trading Forex. One of the biggest problems I had when I first started trading was trying to apply the “rules” to actual trades. Another was the psychology—limiting losses and letting profits run. If you study my blog, you’ll see how I deal with both those issues. So my writings are not trade recommendations but rather educational in purpose. You have to decide on your own approach to trading. Remember that trading is risky.

Tuesday, January 26, 2010

USDJPY—a dud

My trade, the one I categorized as risky (countra-trend) turned out to be a dud. I stopped out at – 70 pips. I now am looking for an entry to go short. My reasons ere:

1) Pair is in an overall downtrend on the longer term charts—monthly, weekly, and daily
2) It fell out of what looked like a bull flag during a rally—not a good sign.
3) Yen is showing across the board strength
4) Move on the daily chart is looking corrective to me—there could be more upside but I’m not risking any more losses while I wait to find out

There are upper and lower shadows on the recent candles on the three-hour chart. The market is undecided so I am as well. Best to stay out until I get a clearer signal. For now, I’m negatively biased toward the pair. Here’s the 3-Hour chart:


© Dianne Fecteau, 2010. No part of this material may be reproduced in any form, or referred to in any other publication, without the express written permission of the author.

My purpose in writing this blog is to show you how one trader, me, makes trading decisions and survives while trading Forex. One of the biggest problems I had when I first started trading was trying to apply the “rules” to actual trades. Another was the psychology—limiting losses and letting profits run. If you study my blog, you’ll see how I deal with both those issues. So my writings are not trade recommendations but rather educational in purpose. You have to decide on your own approach to trading. Remember that trading is risky.

EURUSD—finally moving?

EURUSD was a bore yesterday, hovering in a narrow 63-pip range. Perhaps, now, it’s beginning to move and has fallen from yet another bear flag on the three-hour chart. This break dropped through the trend line on the RSI as well. When I posted the daily Euro Elliott Wave count the other day, I identified this as beginning a primary wave three down.

I’m still short from 1.4325 and obviously profit-stopped. Target of this flag is 137.70 or thereabouts, well shy of the original flag on the daily chart target of around 1.35. As I wrote last week, I have other targets that go to 1.3370 and there’s another uptrend line coming in from the lows of late 2008 that’s currently at 1.28. All nice round numbers and all numbers that would make any self-respecting Euro bull shriek and tear at their clothing. Resistance is 1.4166 (bottom of the three-hour bear flag) and in the middle of the ongoing 1.4150/70 zone, 1.4194 (yesterday’s high), 1.4215/20, 1.4285/90, and 1.4325/40. (1.4325 is the line of the daily bear flag and 1.4334 and 1.4340 were June 2009 highs). It wouldn’t clear this, especially on a first attempt, but let’s leave that problem until it occurs.

You can’t see it on my compressed chart but the last couple of three-hour candles have had lower shadows. These hint that the pair may be rejecting lower prices. The Sysyphean struggle between Euro bulls and bears continues. A solid close below 1.4073 and better, last week’s low of 1.4029 will tip things in the bear’s favor. Next support after that is 1.3973 and 1.3888.

Here’s the three-hour chart:


© Dianne Fecteau, 2010. No part of this material may be reproduced in any form, or referred to in any other publication, without the express written permission of the author.

My purpose in writing this blog is to show you how one trader, me, makes trading decisions and survives while trading Forex. One of the biggest problems I had when I first started trading was trying to apply the “rules” to actual trades. Another was the psychology—limiting losses and letting profits run. If you study my blog, you’ll see how I deal with both those issues. So my writings are not trade recommendations but rather educational in purpose. You have to decide on your own approach to trading. Remember that trading is risky.

USDCAD—just poked above downtrend line

My long position from 1.0256 is currently up 394 pips (as of 7:16 AM EST) but the pair is still struggling a bit, having just poked its head above the nasty resistance of 1.0626. I took a little off the table at +375 pips but still have most of the trade on. Obviously, my stop is profit stopped at + 210 pips.

If it should continue to climb, the next resistance levels are 1.0747/50, 1.0779, and then 1.0853 which has been the high since it started it’s basing action in mid-October. If it should get beyond that, and that is wildly optimistic, next levels are 1.0988 (the September high), and then 1.1125 (the August highs). At that point, ladies and gentlemen, everyone will be saying what I was saying in October—“The pair was basing.” Then I can say, “Do you think so?” Enough of the imaginary conversations! Support lies at 1.0602/09 (the trend line it just peeked above), 1.0581 (that close? Come on!), 1.0475/90 (polarity), and the positively revolting levels of 1.0360/75, and the why do I keep banging my head on the wall, 1.0256.

Here’s the daily chart:


© Dianne Fecteau, 2010. No part of this material may be reproduced in any form, or referred to in any other publication, without the express written permission of the author.

My purpose in writing this blog is to show you how one trader, me, makes trading decisions and survives while trading Forex. One of the biggest problems I had when I first started trading was trying to apply the “rules” to actual trades. Another was the psychology—limiting losses and letting profits run. If you study my blog, you’ll see how I deal with both those issues. So my writings are not trade recommendations but rather educational in purpose. You have to decide on your own approach to trading. Remember that trading is risky.

GBPCHF—fake-out

I originally wrote this over an hour ago but lost internet access and just got back in. Wow, that’s annoying. Things have changed a bit as the pair is now climbing again and will most likely hit my stop which is just better than breakeven (+5 pips). Anyway, here’s what I wrote earlier:

Yesterday I took a short in this pair at 1.6893, primarily because it was at the top of a flag/downward channel on the three-hour chart and because of the overall downtrend. It proceeded to reach a high of 1.6976 before turning back and is now inside the flag or channel again, currently at 1.6812. The breakout was a fake-out. Obviously, I have moved my stop to better than breakeven. I also took partial profits at +77 pips.

I had a wide stop on this pair because of the 1.7037 high on the pair earlier in the month but I would have probably taken partial losses had I been awake to see the mayhem going on while I slept. Yet, that would have been a simple loss of courage because the market isn’t telling me anything until it tops that 1.7037. That’s the nice thing about stops—they tell you when the market isn’t going along with your view of what you thought it would do. I was willing to put up with a wider stop because I thought the profit potential was high—to the bottom of the range as I blogged about last week, somewhere around 1.64 or possibly lower to 1.62. Hooah, if that happens! The problem is that the market seems edgy to me—pairs going up or down enough to violate perfectly sweet lines of support or resistance but not making any huge moves for the most part. That happens after large moves—the market tries to compose itself by dithering about.

Here’s the three-hour chart:


© Dianne Fecteau, 2010. No part of this material may be reproduced in any form, or referred to in any other publication, without the express written permission of the author.

My purpose in writing this blog is to show you how one trader, me, makes trading decisions and survives while trading Forex. One of the biggest problems I had when I first started trading was trying to apply the “rules” to actual trades. Another was the psychology—limiting losses and letting profits run. If you study my blog, you’ll see how I deal with both those issues. So my writings are not trade recommendations but rather educational in purpose. You have to decide on your own approach to trading. Remember that trading is risky.

Monday, January 25, 2010

GBPCHF—shorted at top of flag

I just took a short at 1.6893 because it’s at the top of the flag or downward channel on the three hour chart I posted earlier today. Obviously, I’ll move my stop to breakeven when I can. Also, if there's a good close above the flag, or better, a close above and return to the top of the flag, I'll reverse and go long (most likely).

© Dianne Fecteau, 2010. No part of this material may be reproduced in any form, or referred to in any other publication, without the express written permission of the author.

My purpose in writing this blog is to show you how one trader, me, makes trading decisions and survives while trading Forex. One of the biggest problems I had when I first started trading was trying to apply the “rules” to actual trades. Another was the psychology—limiting losses and letting profits run. If you study my blog, you’ll see how I deal with both those issues. So my writings are not trade recommendations but rather educational in purpose. You have to decide on your own approach to trading. Remember that trading is risky.

GBPJPY—back to the triangle?

My short position from 147.55 is out of the market at 146.35 for + 120 pips.

It’s possible it’s returning to the triangle it fell from last week. That price is at 147.92.

GBPJPY, along with EURJPY, has been in a sideways range for much of 2009. This range is 139.03 to 163.09 although it hasn’t seen those highs since August of last year. There was also a confirmed double top (162.60/163.09) in June and August and the pair broke the trough at 146.77, dropping to a low of 139.71. The price target from that pattern was 130.45 (Peak to trough subtracted from trough or (146.77 – (163.09 – 146.77)). Then the triangle came along where it loitered since early January before dipping down to a low of 144.93 last week. The high as of now (12:25 PM EST) is 146.60.

I plan to enter another short position if it gets near the triangle although it has 130 pips to go before it gets there. However, this pair is more than capable of making that move. As always, it will depend on price action at the time. Two other possibilities for shorting are the Fib retracement levels of 146.86 and 147.35. Any entry requires tight stops.

Here’s the three-hour chart:


© Dianne Fecteau, 2010. No part of this material may be reproduced in any form, or referred to in any other publication, without the express written permission of the author.

My purpose in writing this blog is to show you how one trader, me, makes trading decisions and survives while trading Forex. One of the biggest problems I had when I first started trading was trying to apply the “rules” to actual trades. Another was the psychology—limiting losses and letting profits run. If you study my blog, you’ll see how I deal with both those issues. So my writings are not trade recommendations but rather educational in purpose. You have to decide on your own approach to trading. Remember that trading is risky.

GBPCHF—may be bouncing

The pair has bounced a bit, as it seems wont to do. I’m still short from 1.6897. Earlier this morning I took some partial profits at 1.6784 for + 113 pips since it appeared to be climbing. The pair hasn’t been above 1.7037 this month. Remember that this trade was a pure range trade, ranging from 1.6118 to 1.7113 since mid-September. The low last week was 1.6734.

Resistance is at 1.6851 (.38 retracement from the low, 1.6888 (50% retracement), and 1.6931 (recent high). Support is at 1.6765 (this morning’s low), 1.6734 (last week’s low), and 1.6716 (polarity, which means it has served as both support and resistance).

The three-hour chart appears to have a bull flag formation (for the optimists) or a downward channel. The price projection from this is above 1.75, a psychological round number and polarity. A close above the flag line, around 1.6890 might be worth looking at for a long. On the other hand, shorts would be able to set a tight stop there. The decision will depend on price action at the time.

Here’s the 3-hour chart:


© Dianne Fecteau, 2010. No part of this material may be reproduced in any form, or referred to in any other publication, without the express written permission of the author.

My purpose in writing this blog is to show you how one trader, me, makes trading decisions and survives while trading Forex. One of the biggest problems I had when I first started trading was trying to apply the “rules” to actual trades. Another was the psychology—limiting losses and letting profits run. If you study my blog, you’ll see how I deal with both those issues. So my writings are not trade recommendations but rather educational in purpose. You have to decide on your own approach to trading. Remember that trading is risky.

USDCAD—up but needs a close above 1.0600

My long position from 1.0256 is up 320 pips as I write (8:06 AM EST). The pair reached a high of 1.0602 on Friday but there needs to be a solid close above 1.06. This is nasty resistance in here up through 1.0626 where a downtrend line comes in. If it does manage a good close above 1.0626, then I may add to my long position depending on price action. Here’s the daily chart:


© Dianne Fecteau, 2010. No part of this material may be reproduced in any form, or referred to in any other publication, without the express written permission of the author.

My purpose in writing this blog is to show you how one trader, me, makes trading decisions and survives while trading Forex. One of the biggest problems I had when I first started trading was trying to apply the “rules” to actual trades. Another was the psychology—limiting losses and letting profits run. If you study my blog, you’ll see how I deal with both those issues. So my writings are not trade recommendations but rather educational in purpose. You have to decide on your own approach to trading. Remember that trading is risky.

USDJPY—pennant on daily

In what may be one of my riskier trades, I just went long USDJPY at 90.25. It’s a contra-trend trade, against a strong downtrend so one has to be careful. I would have gone long Friday at the close on the nice daily doji but I don’t take positions at the start of the weekend. This morning I was busy with other things and just got around to this pair. It’s already climbed a bit so it’s not quite as good an entry as I would have liked but there you go. This particular type of doji is called a gravestone doji. How’s that for creepy and bearish? However, the gravestone doji, like most doji, seems to be more effective when it occurs at tops. A couple of things, though, persuaded me there may be some strength coming in this pair.

First, there is a rally going on of sorts. After this low of 84.83 in November, the pair reached a high of 93.77 earlier this month. The daily chart now shows a pennant formation. A pennant is a flag with pointed, converging lines. When a pennant is slanting towards the trend (in this case up), the breakout is often a continuation move. The recent move up also looks impulsive to me. This could be an A wave of a correction and the C wave could end higher than the top of A. Regardless, as soon as I can I’m moving my stop to breakeven.

Resistance is at 90.57 (the high of the doji), 91.35 (the top of the pennant), and 91.87 (January 21 high). Support is at 89.79, 89.23 (January 21 low and fib retracement), and 88.32 (recent low). Here is the daily chart:


© Dianne Fecteau, 2010. No part of this material may be reproduced in any form, or referred to in any other publication, without the express written permission of the author.

My purpose in writing this blog is to show you how one trader, me, makes trading decisions and survives while trading Forex. One of the biggest problems I had when I first started trading was trying to apply the “rules” to actual trades. Another was the psychology—limiting losses and letting profits run. If you study my blog, you’ll see how I deal with both those issues. So my writings are not trade recommendations but rather educational in purpose. You have to decide on your own approach to trading. Remember that trading is risky.

EURUSD—correcting for now

My short still stands from 1.4325 although there’s a bit of a correction going on.

Euro has climbed as high as 1.4194 so far this morning so it made it through the 1.4550/70 resistance area. Next resistance levels are 1.4215/20, 1.4217 (the low of the daily bear flag and near a Fib correction), and then on up to 1.4285/90, and 1.4325/40. 1.4325 is the current bottom of the upward sloping bear flag and 1.4334 and 1.4340 were June 2009 highs so resistance there would be fierce. If the Euro managed to break through that, then Euro bulls would be making like Pamplona. One could make a case for an alternative daily Elliott Wave count that would have the move down from 1.5141 to the low of 1.4029 be a zigzag correction but I do not think that makes sense given the overall counts on several time frames. A close above 1.5141 would cause me to change my belief.

More likely, it seems to me, is that it will head down again because price objectives are still unmet from the daily bear flag and because of overall weakness. If it does so, then likely targets are 1.3833 and 1.3748. A close below the 1.4029 would support that argument.

What do you do if you have no position right now? The most conservative action would be to take no action and let the pair sort itself out over the next few hours into late morning EST. It will become clearer. You could also short at any of the resistance levels with very tight stops if you’re tending towards the bearish as I am. Looking at the 5-minute chart, Euro is tracing out what could be a Head and Shoulders formation. A break below 1.4177 would validate it and I may add to my short there. Remember, though, this is only a five-minute chart.


© Dianne Fecteau, 2010. No part of this material may be reproduced in any form, or referred to in any other publication, without the express written permission of the author.

My purpose in writing this blog is to show you how one trader, me, makes trading decisions and survives while trading Forex. One of the biggest problems I had when I first started trading was trying to apply the “rules” to actual trades. Another was the psychology—limiting losses and letting profits run. If you study my blog, you’ll see how I deal with both those issues. So my writings are not trade recommendations but rather educational in purpose. You have to decide on your own approach to trading. Remember that trading is risky.