USDJPY touched 80.30 which is one pip below the Nov. 2010 low of 80.31. After this, there isn't another low unless one goes back to April, 1995 where the low was 79.70. It's not that far away in price.
© Dianne Fecteau, 2011. No part of this material may be reproduced in any form, or referred to in any other publication, without the express written permission of the author.
My purpose in writing this blog is to show you how one trader, me, makes trading decisions and survives while trading Forex. One of the biggest problems I had when I first started trading was trying to apply the “rules” to actual trades. Another was the psychology—limiting losses and letting profits run. If you study my blog, you’ll see how I deal with both those issues. So my writings are not trade recommendations but rather educational in purpose. You have to decide on your own approach to trading. Remember that trading is risky.
Wednesday, March 16, 2011

EURUSD—resistance
The Euro is having a terrible time breaking above the 1.4036 resistance. Some people are talking about a potential double top but it won't be a double top until price breaks below 1.3752. The nice thing about it hanging about just below 1.40 (high yesterday was 1.4013) is that if one wants to short, one can have a very tight stop. The 1.4013 high led to an evening star formation on the three-hour chart. Beware, though, of pairs hanging around just below resistance. They often break through. If someone wants to go long, I'd wait for a pullback at this point.
© Dianne Fecteau, 2011. No part of this material may be reproduced in any form, or referred to in any other publication, without the express written permission of the author.
My purpose in writing this blog is to show you how one trader, me, makes trading decisions and survives while trading Forex. One of the biggest problems I had when I first started trading was trying to apply the “rules” to actual trades. Another was the psychology—limiting losses and letting profits run. If you study my blog, you’ll see how I deal with both those issues. So my writings are not trade recommendations but rather educational in purpose. You have to decide on your own approach to trading. Remember that trading is risky.
© Dianne Fecteau, 2011. No part of this material may be reproduced in any form, or referred to in any other publication, without the express written permission of the author.
My purpose in writing this blog is to show you how one trader, me, makes trading decisions and survives while trading Forex. One of the biggest problems I had when I first started trading was trying to apply the “rules” to actual trades. Another was the psychology—limiting losses and letting profits run. If you study my blog, you’ll see how I deal with both those issues. So my writings are not trade recommendations but rather educational in purpose. You have to decide on your own approach to trading. Remember that trading is risky.
GBPJPY—daily chart
The Guppy has moved down sharply from its February 18 high of 135.54. The low yesterday was 129.19.
Where might this drop end? The most likely area is 128.86/10. There are several reasons. First, 128.86 is confluence. Second, 1.2881 is a support from the weekly pivot. 1.2832 is the January low. Finally, if one assumes that an A wave began at 1.3554 and ended at 131.13, and the B wave ended at 135.24, then wave C will be 1.618 of A at 128.10. One thing to note is that a broken former trend line comes in below 128 so if the pair is going to retest it that moves support downwards.
If this support zone doesn't hold price, then the next support is at 125.51 so if one tries a long position in the 128 support zone, use a stop that matches your risk tolerance.
Will it go to 125.51 and possibly below? Who knows? There's some evidence it could. For example, on the daily chart below, the break upward, above the trend line, even though sustained for over six weeks, could be a false break. A close below 125.51 would confirm that. One could also argue that the move up to 135.54 was a three wave correction on the daily chart.
Watch behavior, both momentum and price, in the 128 zone if price reaches that level, for clues as to future behavior.
Here's the daily chart.

© Dianne Fecteau, 2011. No part of this material may be reproduced in any form, or referred to in any other publication, without the express written permission of the author.
My purpose in writing this blog is to show you how one trader, me, makes trading decisions and survives while trading Forex. One of the biggest problems I had when I first started trading was trying to apply the “rules” to actual trades. Another was the psychology—limiting losses and letting profits run. If you study my blog, you’ll see how I deal with both those issues. So my writings are not trade recommendations but rather educational in purpose. You have to decide on your own approach to trading. Remember that trading is risky.
Where might this drop end? The most likely area is 128.86/10. There are several reasons. First, 128.86 is confluence. Second, 1.2881 is a support from the weekly pivot. 1.2832 is the January low. Finally, if one assumes that an A wave began at 1.3554 and ended at 131.13, and the B wave ended at 135.24, then wave C will be 1.618 of A at 128.10. One thing to note is that a broken former trend line comes in below 128 so if the pair is going to retest it that moves support downwards.
If this support zone doesn't hold price, then the next support is at 125.51 so if one tries a long position in the 128 support zone, use a stop that matches your risk tolerance.
Will it go to 125.51 and possibly below? Who knows? There's some evidence it could. For example, on the daily chart below, the break upward, above the trend line, even though sustained for over six weeks, could be a false break. A close below 125.51 would confirm that. One could also argue that the move up to 135.54 was a three wave correction on the daily chart.
Watch behavior, both momentum and price, in the 128 zone if price reaches that level, for clues as to future behavior.
Here's the daily chart.

© Dianne Fecteau, 2011. No part of this material may be reproduced in any form, or referred to in any other publication, without the express written permission of the author.
My purpose in writing this blog is to show you how one trader, me, makes trading decisions and survives while trading Forex. One of the biggest problems I had when I first started trading was trying to apply the “rules” to actual trades. Another was the psychology—limiting losses and letting profits run. If you study my blog, you’ll see how I deal with both those issues. So my writings are not trade recommendations but rather educational in purpose. You have to decide on your own approach to trading. Remember that trading is risky.
USD Index—holding support
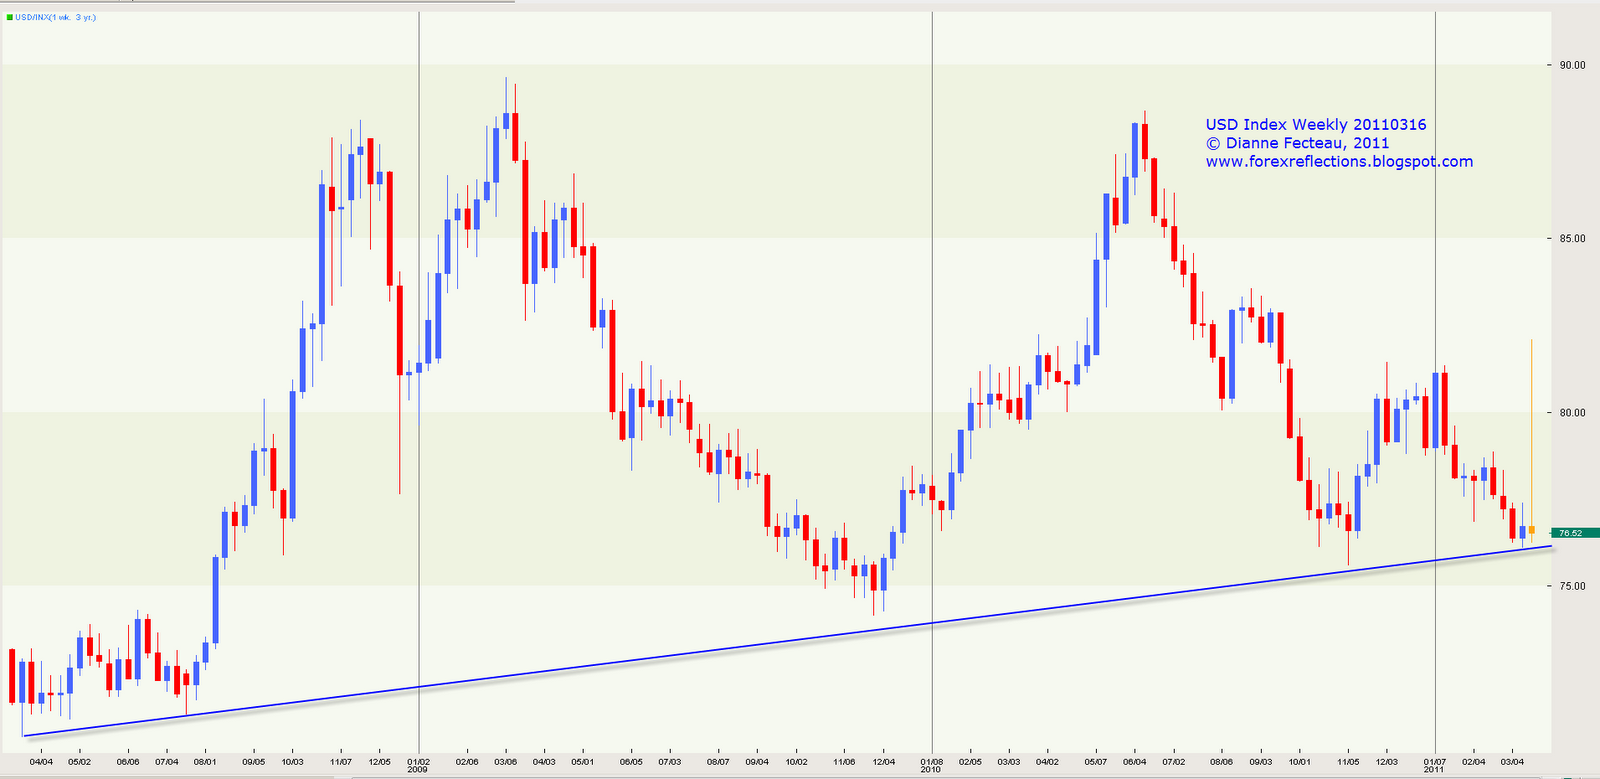
When I was analyzing the monthly chart earlier this month, I stated, "Until the index drops below 75.62, "the dollar is in a position to rise. It has not dropped below that price. This is despite the overwhelming sentiment against the dollar. For example, if you look at the Commitment of Traders (COT) report, you can see the extreme short position in the dollar. Yet the dollar is holding its uptrend line on the charts, drawn from the 2008 low. That line has had two touches prior to last week's third touch, so it is a valid trend line. Interestingly, the last two lows (74.16 in Nov. '09 and 77.42 in Nov. '10) didn't make it down to the line.
This isn't to say the buck won't penetrate and close below that line. Last week, the low of 76.11 was perilously close. However, extreme sentiment against an asset class when that asset is at support lows is often the formula for a rise. The point here is that the trader must be careful. If she or he holds the opinion that the dollar is going down, this isn't exactly the place to jump in since it's holding support. That trader should already be short with profits locked in place. Going short now requires a close below the trend line and even then, one would want a tight stop. The profit potential is limited since the 75.62 prior swing low is just below. Why would anyone even be considering going short now? Talk about being late to the party. If everyone is already short (as the COT report shows), then who is left to sell? If you want to go short, read my blog on March 2 when I discussed the monthly chart and wait for a rally.
The trader who wants to go long is in a stronger position since the index is at support. However, the trader must actively manage the trade. Nonetheless, my bias is long at this point because the chart supports that position technically. If one went long and the pair closes beneath the trend line, it would be a warning. If price moves below 74.16 that would be the confirmation point for a double top and the hint for new, heart stopping lows.
Here's the weekly chart. It looks as though there was a data error for this week with the spike up so ignore the long upper shadow.

© Dianne Fecteau, 2011. No part of this material may be reproduced in any form, or referred to in any other publication, without the express written permission of the author.
My purpose in writing this blog is to show you how one trader, me, makes trading decisions and survives while trading Forex. One of the biggest problems I had when I first started trading was trying to apply the “rules” to actual trades. Another was the psychology—limiting losses and letting profits run. If you study my blog, you’ll see how I deal with both those issues. So my writings are not trade recommendations but rather educational in purpose. You have to decide on your own approach to trading. Remember that trading is risky.
This isn't to say the buck won't penetrate and close below that line. Last week, the low of 76.11 was perilously close. However, extreme sentiment against an asset class when that asset is at support lows is often the formula for a rise. The point here is that the trader must be careful. If she or he holds the opinion that the dollar is going down, this isn't exactly the place to jump in since it's holding support. That trader should already be short with profits locked in place. Going short now requires a close below the trend line and even then, one would want a tight stop. The profit potential is limited since the 75.62 prior swing low is just below. Why would anyone even be considering going short now? Talk about being late to the party. If everyone is already short (as the COT report shows), then who is left to sell? If you want to go short, read my blog on March 2 when I discussed the monthly chart and wait for a rally.
The trader who wants to go long is in a stronger position since the index is at support. However, the trader must actively manage the trade. Nonetheless, my bias is long at this point because the chart supports that position technically. If one went long and the pair closes beneath the trend line, it would be a warning. If price moves below 74.16 that would be the confirmation point for a double top and the hint for new, heart stopping lows.
Here's the weekly chart. It looks as though there was a data error for this week with the spike up so ignore the long upper shadow.
© Dianne Fecteau, 2011. No part of this material may be reproduced in any form, or referred to in any other publication, without the express written permission of the author.
My purpose in writing this blog is to show you how one trader, me, makes trading decisions and survives while trading Forex. One of the biggest problems I had when I first started trading was trying to apply the “rules” to actual trades. Another was the psychology—limiting losses and letting profits run. If you study my blog, you’ll see how I deal with both those issues. So my writings are not trade recommendations but rather educational in purpose. You have to decide on your own approach to trading. Remember that trading is risky.
Tuesday, March 15, 2011
AUDUSD—Monday close below parity
Aussie had its first close below parity in 19 days, finishing Monday at .9947. With all the bad news coming from Japan, prices this morning have dropped to a low of .9861. Fear of radioactivity spreading throughout the Pacific Rim may drive price lower. I'm going to assume that this is not as bad as the situation was at Chernobyl in 1986 and try to focus on technical levels.
AUDUSD was showing signs of weakness before this news event happened. As I've written before, this could be the C leg of a correction on the weekly chart (1.0183 to .9804 being wave A; the move up to 1.0257 being wave B). If this is true, one could see corrections down to .9858 (C=.618A), .9611 (C=A), or .9211 (C=1.618A).
In a situation such as this, I look for confirmation of any given price projection from other methods. In this case, Aussie has a layer of support from .9988 down 179 pips to the prior swing low of .9804. It consists of monthly and weekly pivot support levels, fib retracements (the .382, .5, and .618 of the .9537 to 1.0257 move), the daily 100 SMA, and the weekly 20 EMA. From this, it's reasonable to expect that the C leg might limit itself to approximately .618 of the A leg, a point of view that would be consistent with a reaction after a good climb and with the long-term uptrend.
Should the pair drop below the .9800 level, there's additional support at from .9611 to .9518. This includes the .9537 swing low as well as the daily 200 SMA. However, this drop would confirm the head and shoulders or double/triple top pattern. The target of these is .8819. However, I'll wait until that happens before I try to confirm that number.
The initial support zone is wide at 179 pips but the pair is nearing its bottom. Probably the best action is to sit this out if you're an inexperienced trader. I know that nobody considers themselves inexperienced—after a few months of the trading wars, one can feel rather old. If one has to trade, one might try a buy near the bottom of the support zone with a tight stop. The other possibility, if things continue to look dire, is to sell a rally. The fibs of the most recent drop are .9929 to .9996.
© Dianne Fecteau, 2011. No part of this material may be reproduced in any form, or referred to in any other publication, without the express written permission of the author.
My purpose in writing this blog is to show you how one trader, me, makes trading decisions and survives while trading Forex. One of the biggest problems I had when I first started trading was trying to apply the “rules” to actual trades. Another was the psychology—limiting losses and letting profits run. If you study my blog, you’ll see how I deal with both those issues. So my writings are not trade recommendations but rather educational in purpose. You have to decide on your own approach to trading. Remember that trading is risky.
AUDUSD was showing signs of weakness before this news event happened. As I've written before, this could be the C leg of a correction on the weekly chart (1.0183 to .9804 being wave A; the move up to 1.0257 being wave B). If this is true, one could see corrections down to .9858 (C=.618A), .9611 (C=A), or .9211 (C=1.618A).
In a situation such as this, I look for confirmation of any given price projection from other methods. In this case, Aussie has a layer of support from .9988 down 179 pips to the prior swing low of .9804. It consists of monthly and weekly pivot support levels, fib retracements (the .382, .5, and .618 of the .9537 to 1.0257 move), the daily 100 SMA, and the weekly 20 EMA. From this, it's reasonable to expect that the C leg might limit itself to approximately .618 of the A leg, a point of view that would be consistent with a reaction after a good climb and with the long-term uptrend.
Should the pair drop below the .9800 level, there's additional support at from .9611 to .9518. This includes the .9537 swing low as well as the daily 200 SMA. However, this drop would confirm the head and shoulders or double/triple top pattern. The target of these is .8819. However, I'll wait until that happens before I try to confirm that number.
The initial support zone is wide at 179 pips but the pair is nearing its bottom. Probably the best action is to sit this out if you're an inexperienced trader. I know that nobody considers themselves inexperienced—after a few months of the trading wars, one can feel rather old. If one has to trade, one might try a buy near the bottom of the support zone with a tight stop. The other possibility, if things continue to look dire, is to sell a rally. The fibs of the most recent drop are .9929 to .9996.
© Dianne Fecteau, 2011. No part of this material may be reproduced in any form, or referred to in any other publication, without the express written permission of the author.
My purpose in writing this blog is to show you how one trader, me, makes trading decisions and survives while trading Forex. One of the biggest problems I had when I first started trading was trying to apply the “rules” to actual trades. Another was the psychology—limiting losses and letting profits run. If you study my blog, you’ll see how I deal with both those issues. So my writings are not trade recommendations but rather educational in purpose. You have to decide on your own approach to trading. Remember that trading is risky.
Monday, March 14, 2011
EURUSD--retracement
Euro has retraced much of the move down from 1.4036, reaching a high of 1.3981 this morning. As long as prices stay beneath 1.4036, one can argue that the high was the end of an ABC correction from 1.2859. Remember, that high was within a strong resistance zone consisting of trend and speed lines. On the way down, the pair broke key support. There have been some bearish signals in different periods.
From 1.4036, it's possible to count five waves down to 1.3752 on the three-hour chart. As a result, this could be wave two. The rate of ascent is steep which is generally unsustainable. What I don't like on the hourly chart is the momentum, as represented by RSI. Note that it didn't drop that much. In addition, the low was almost at the 50% retracement of the 1.3429/1.4036 move. However, my bias is short and I may establish a short position. I'm looking at shorter periods to decide on this. The stop can be tight since over 1.4036 will tell me I'm wrong.
Support is at 1.3880, 1.3805, 1.3752/32 (recent low and .50 retracement), 1.3685 (fib confluence), 1.3500 and 1.3429. If prices start to edge above 1.40 and sustain a close over 1.4036, the next resistance is 1.4282/95 and 1.4317.

© Dianne Fecteau, 2011. No part of this material may be reproduced in any form, or referred to in any other publication, without the express written permission of the author.
My purpose in writing this blog is to show you how one trader, me, makes trading decisions and survives while trading Forex. One of the biggest problems I had when I first started trading was trying to apply the “rules” to actual trades. Another was the psychology—limiting losses and letting profits run. If you study my blog, you’ll see how I deal with both those issues. So my writings are not trade recommendations but rather educational in purpose. You have to decide on your own approach to trading. Remember that trading is risky.
From 1.4036, it's possible to count five waves down to 1.3752 on the three-hour chart. As a result, this could be wave two. The rate of ascent is steep which is generally unsustainable. What I don't like on the hourly chart is the momentum, as represented by RSI. Note that it didn't drop that much. In addition, the low was almost at the 50% retracement of the 1.3429/1.4036 move. However, my bias is short and I may establish a short position. I'm looking at shorter periods to decide on this. The stop can be tight since over 1.4036 will tell me I'm wrong.
Support is at 1.3880, 1.3805, 1.3752/32 (recent low and .50 retracement), 1.3685 (fib confluence), 1.3500 and 1.3429. If prices start to edge above 1.40 and sustain a close over 1.4036, the next resistance is 1.4282/95 and 1.4317.

© Dianne Fecteau, 2011. No part of this material may be reproduced in any form, or referred to in any other publication, without the express written permission of the author.
My purpose in writing this blog is to show you how one trader, me, makes trading decisions and survives while trading Forex. One of the biggest problems I had when I first started trading was trying to apply the “rules” to actual trades. Another was the psychology—limiting losses and letting profits run. If you study my blog, you’ll see how I deal with both those issues. So my writings are not trade recommendations but rather educational in purpose. You have to decide on your own approach to trading. Remember that trading is risky.
Week Ending Numbers
Here are the high, low and close for last week:

© Dianne Fecteau, 2011. No part of this material may be reproduced in any form, or referred to in any other publication, without the express written permission of the author.
My purpose in writing this blog is to show you how one trader, me, makes trading decisions and survives while trading Forex. One of the biggest problems I had when I first started trading was trying to apply the “rules” to actual trades. Another was the psychology—limiting losses and letting profits run. If you study my blog, you’ll see how I deal with both those issues. So my writings are not trade recommendations but rather educational in purpose. You have to decide on your own approach to trading. Remember that trading is risky.

© Dianne Fecteau, 2011. No part of this material may be reproduced in any form, or referred to in any other publication, without the express written permission of the author.
My purpose in writing this blog is to show you how one trader, me, makes trading decisions and survives while trading Forex. One of the biggest problems I had when I first started trading was trying to apply the “rules” to actual trades. Another was the psychology—limiting losses and letting profits run. If you study my blog, you’ll see how I deal with both those issues. So my writings are not trade recommendations but rather educational in purpose. You have to decide on your own approach to trading. Remember that trading is risky.
Subscribe to:
Posts (Atom)