I have not blogged about the dollar index recently. On the monthly chart, one can make the case for a move up from the bottom of the symmetrical triangle where it will find resistance at either the longer term downtrend line (80.47) or the upper boundary of the triangle at 88.49. The move from 89.63 down to 74.15 (1,548) had a nice balance with the move from 88.66 down to 72.69 (1,597).
Any drop below 72.69 would be bearish. It would also raise the possibility that there is a double top in with the confirmation point at 73.50. The price target would be 69.81. No doubt that would bring on the same tired response from the US Treasury that “we support a strong dollar.”
Nonetheless, given the potential weakness in the Euro and other currencies relative to the USD, I think a rally is more probable.
Here’s the monthly chart:
© Dianne Fecteau, 2011. No part of this material may be reproduced in any form, or referred to in any other publication, without the express written permission of the author.
My purpose in writing this blog is to show you how one trader, me, makes trading decisions and survives while trading Forex. One of the biggest problems I had when I first started trading was trying to apply the “rules” to actual trades. Another was the psychology—limiting losses and letting profits run. If you study my blog, you’ll see how I deal with both those issues. So my writings are not trade recommendations but rather educational in purpose. You have to decide on your own approach to trading. Remember that trading is risky.
Showing posts with label USD. Show all posts
Monday, June 20, 2011
Monday, May 9, 2011
USD Index—Weekly
Last week was a nice bullish engulfing candle for the USD. One could make the case for the recent low of 72.69 being an Elliott wave two. This would suggest that the price behavior for the last two years from the 89.63 high was a complex, double zigzag correction (WXY). One could also argue against this, i.e. the move that ended at 88.66 was an ABC correction with the downtrend now resuming.
Another way to look at the weekly chart is as a contracting rectangle. I like this interpretation as it is simple, in line with Occam's Razor. The top of the rectangle is at 88. However, whether one chooses the optimistic Elliott interpretation or the rectangle one, the next move should be up. If the buck can climb above 75 then next resistance is at 75.82, then 78.87 and 81.45. Support is obviously the recent low of 72.69, then 71.31 and 70.67.
Here is the weekly chart:

© Dianne Fecteau, 2011. No part of this material may be reproduced in any form, or referred to in any other publication, without the express written permission of the author.
My purpose in writing this blog is to show you how one trader, me, makes trading decisions and survives while trading Forex. One of the biggest problems I had when I first started trading was trying to apply the “rules” to actual trades. Another was the psychology—limiting losses and letting profits run. If you study my blog, you’ll see how I deal with both those issues. So my writings are not trade recommendations but rather educational in purpose. You have to decide on your own approach to trading. Remember that trading is risky.
Another way to look at the weekly chart is as a contracting rectangle. I like this interpretation as it is simple, in line with Occam's Razor. The top of the rectangle is at 88. However, whether one chooses the optimistic Elliott interpretation or the rectangle one, the next move should be up. If the buck can climb above 75 then next resistance is at 75.82, then 78.87 and 81.45. Support is obviously the recent low of 72.69, then 71.31 and 70.67.
Here is the weekly chart:

© Dianne Fecteau, 2011. No part of this material may be reproduced in any form, or referred to in any other publication, without the express written permission of the author.
My purpose in writing this blog is to show you how one trader, me, makes trading decisions and survives while trading Forex. One of the biggest problems I had when I first started trading was trying to apply the “rules” to actual trades. Another was the psychology—limiting losses and letting profits run. If you study my blog, you’ll see how I deal with both those issues. So my writings are not trade recommendations but rather educational in purpose. You have to decide on your own approach to trading. Remember that trading is risky.
Tuesday, March 29, 2011
USD Index—daily ending diagonal
On the daily chart, one can interpret recent price action as an ending diagonal. I've marked it in red on the chart below. Prechter, in his book, Elliott Wave Principal, defines several rules for ending diagonals. In EW theory, rules cannot be broken.
The first rule is that an ending diagonal (ED) always subdivides into five waves. The second rule is that it must always occur in wave five of an impulse wave or wave C of a corrective zigzag or flat. Rule three states that each wave of the ED must divide into zigzags.
There are four rules concerning price action, i.e. wave two cannot exceed wave one, wave three always goes beyond wave one and wave four never exceeds wave two. In addition, this is the only time wave four can enter into wave one's price.
The pattern traced out on the daily chart meets all of these rules. including wave four penetrating wave one's price.
There are also several guidelines. For example, waves two and four usually retrace between 66 and 81% of the prior wave's price action. That doesn't happen here (in both cases it's less than 50%) but guidelines are just that—they don't have to be in place. Nonetheless, a reaction that can't reach more than 38% or so of the prior wave usually indicates a very strong trend down so an ED can fail. Nobody, unfortunately, has ever produced a valid study showing the validity of EW theory, let alone the performance of something such as the ED. The thing is, though, that if this ED does fail, i.e. price drops below the 75.24 low, that's a powerful signal.
If it is a successful ED pattern, then price action out of it is usually fast and powerful. This would be to the upside. There's other evidence for a violent move if price increases. There's significant sentiment against the USD. It's difficult to believe there are many people left to sell. The people jumping in now are typically weak players. Any rise in price would cause significant short covering. This would fuel an additional rise. This type of behavior leads to fast moves.
Note also the positive divergence on the daily chart. Whatever you think of the USD potential, this isn't the time to be going short.
There are other ways to interpret this chart than EW theory. As I wrote last week about the weekly chart, any move below the prior swing low of 74.16 confirms the downtrend with a lower low (and lower high). The failure of this ED from an Elliott perspective would hint at that possibility. Failed patterns are powerful signals. One can also see the possibility for a rectangle signaling range trading on this chart. I've marked it in blue. However, the next move would be up in that case to about 81.10. Coincident or not, that target is near the price projection of 81.35 from the ED (the origin of the pattern).
Here's the daily chart:
© Dianne Fecteau, 2011. No part of this material may be reproduced in any form, or referred to in any other publication, without the express written permission of the author. My purpose in writing this blog is to show you how one trader, me, makes trading decisions and survives while trading Forex. One of the biggest problems I had when I first started trading was trying to apply the “rules” to actual trades. Another was the psychology—limiting losses and letting profits run. If you study my blog, you’ll see how I deal with both those issues. So my writings are not trade recommendations but rather educational in purpose. You have to decide on your own approach to trading. Remember that trading is risky.
The first rule is that an ending diagonal (ED) always subdivides into five waves. The second rule is that it must always occur in wave five of an impulse wave or wave C of a corrective zigzag or flat. Rule three states that each wave of the ED must divide into zigzags.
There are four rules concerning price action, i.e. wave two cannot exceed wave one, wave three always goes beyond wave one and wave four never exceeds wave two. In addition, this is the only time wave four can enter into wave one's price.
The pattern traced out on the daily chart meets all of these rules. including wave four penetrating wave one's price.
There are also several guidelines. For example, waves two and four usually retrace between 66 and 81% of the prior wave's price action. That doesn't happen here (in both cases it's less than 50%) but guidelines are just that—they don't have to be in place. Nonetheless, a reaction that can't reach more than 38% or so of the prior wave usually indicates a very strong trend down so an ED can fail. Nobody, unfortunately, has ever produced a valid study showing the validity of EW theory, let alone the performance of something such as the ED. The thing is, though, that if this ED does fail, i.e. price drops below the 75.24 low, that's a powerful signal.
If it is a successful ED pattern, then price action out of it is usually fast and powerful. This would be to the upside. There's other evidence for a violent move if price increases. There's significant sentiment against the USD. It's difficult to believe there are many people left to sell. The people jumping in now are typically weak players. Any rise in price would cause significant short covering. This would fuel an additional rise. This type of behavior leads to fast moves.
Note also the positive divergence on the daily chart. Whatever you think of the USD potential, this isn't the time to be going short.
There are other ways to interpret this chart than EW theory. As I wrote last week about the weekly chart, any move below the prior swing low of 74.16 confirms the downtrend with a lower low (and lower high). The failure of this ED from an Elliott perspective would hint at that possibility. Failed patterns are powerful signals. One can also see the possibility for a rectangle signaling range trading on this chart. I've marked it in blue. However, the next move would be up in that case to about 81.10. Coincident or not, that target is near the price projection of 81.35 from the ED (the origin of the pattern).
Here's the daily chart:
© Dianne Fecteau, 2011. No part of this material may be reproduced in any form, or referred to in any other publication, without the express written permission of the author. My purpose in writing this blog is to show you how one trader, me, makes trading decisions and survives while trading Forex. One of the biggest problems I had when I first started trading was trying to apply the “rules” to actual trades. Another was the psychology—limiting losses and letting profits run. If you study my blog, you’ll see how I deal with both those issues. So my writings are not trade recommendations but rather educational in purpose. You have to decide on your own approach to trading. Remember that trading is risky.
Wednesday, March 23, 2011
USD Index—Yucky
I've been blogging relative to the weekly and monthly charts that "Until the index drops below 75.62, the dollar is in a position to rise".
Any asset class down to zero is in a position to rise. However, the index has penetrated that price support which definitely increases the yuck factor for the USD. I'm not sure who could still be selling because of the overwhelming sentiment against the buck but there's definitely an absence of buyers. If, for some reason, the price did move up, you'd probably see a great rush of short covering. In other words, the move would be violent.
The next support is the swing low of 74.16.
At this point, the index might have completed a C wave of a large ABC correction. I've marked it on the weekly chart below. There's also positive divergence with RSI on the weekly chart. That's pretty much it, though, for positive thinking Elliott Wave projections. One could also create a wave count that has this dropping below 70.90 but I don't think it's going to do that.
Here's the weekly chart:

© Dianne Fecteau, 2011. No part of this material may be reproduced in any form, or referred to in any other publication, without the express written permission of the author.
My purpose in writing this blog is to show you how one trader, me, makes trading decisions and survives while trading Forex. One of the biggest problems I had when I first started trading was trying to apply the “rules” to actual trades. Another was the psychology—limiting losses and letting profits run. If you study my blog, you’ll see how I deal with both those issues. So my writings are not trade recommendations but rather educational in purpose. You have to decide on your own approach to trading. Remember that trading is risky.
Any asset class down to zero is in a position to rise. However, the index has penetrated that price support which definitely increases the yuck factor for the USD. I'm not sure who could still be selling because of the overwhelming sentiment against the buck but there's definitely an absence of buyers. If, for some reason, the price did move up, you'd probably see a great rush of short covering. In other words, the move would be violent.
The next support is the swing low of 74.16.
At this point, the index might have completed a C wave of a large ABC correction. I've marked it on the weekly chart below. There's also positive divergence with RSI on the weekly chart. That's pretty much it, though, for positive thinking Elliott Wave projections. One could also create a wave count that has this dropping below 70.90 but I don't think it's going to do that.
Here's the weekly chart:

© Dianne Fecteau, 2011. No part of this material may be reproduced in any form, or referred to in any other publication, without the express written permission of the author.
My purpose in writing this blog is to show you how one trader, me, makes trading decisions and survives while trading Forex. One of the biggest problems I had when I first started trading was trying to apply the “rules” to actual trades. Another was the psychology—limiting losses and letting profits run. If you study my blog, you’ll see how I deal with both those issues. So my writings are not trade recommendations but rather educational in purpose. You have to decide on your own approach to trading. Remember that trading is risky.
Wednesday, March 16, 2011
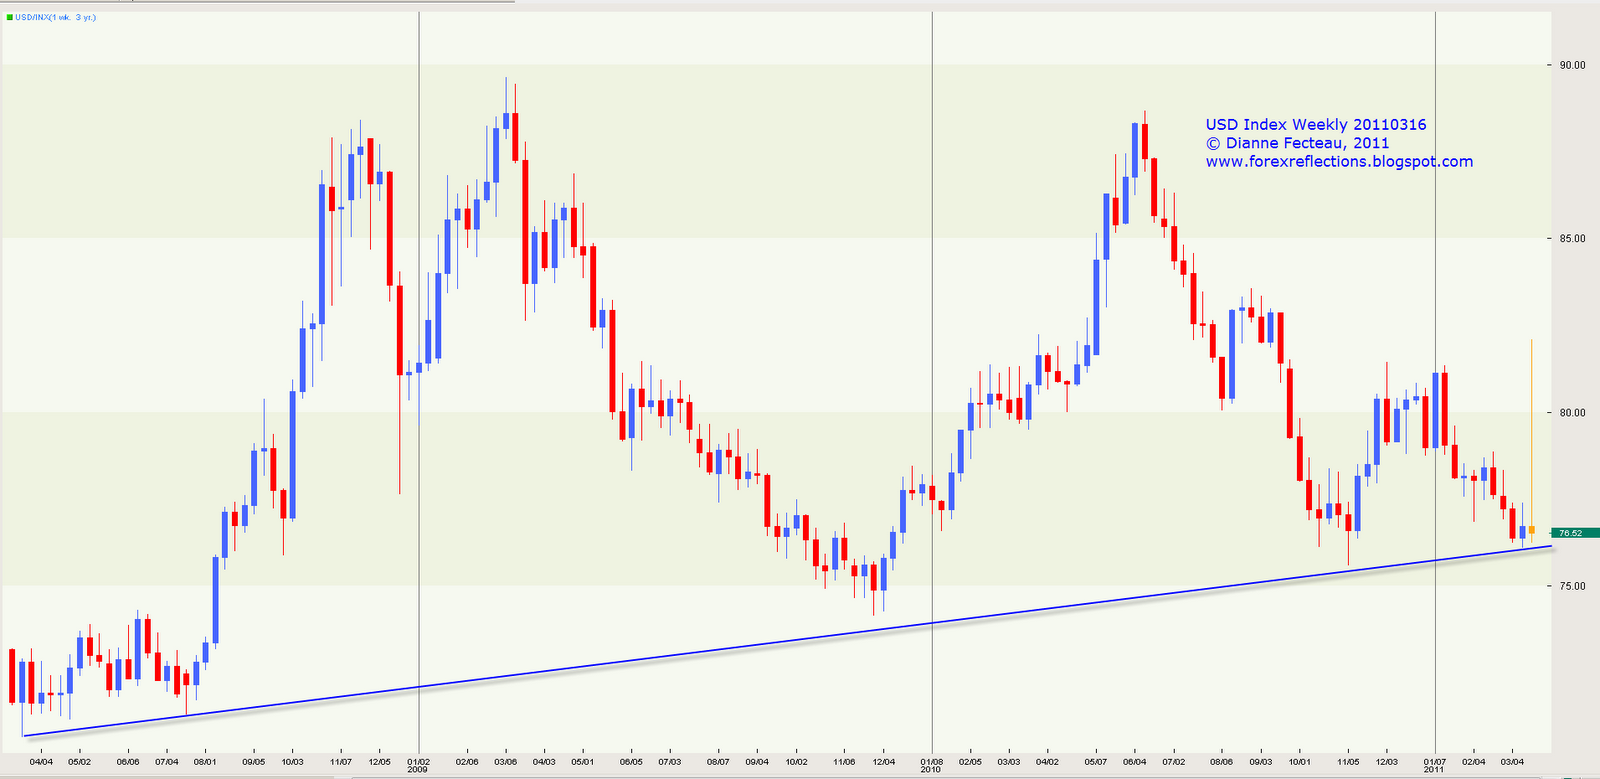
USD Index—holding support
When I was analyzing the monthly chart earlier this month, I stated, "Until the index drops below 75.62, "the dollar is in a position to rise. It has not dropped below that price. This is despite the overwhelming sentiment against the dollar. For example, if you look at the Commitment of Traders (COT) report, you can see the extreme short position in the dollar. Yet the dollar is holding its uptrend line on the charts, drawn from the 2008 low. That line has had two touches prior to last week's third touch, so it is a valid trend line. Interestingly, the last two lows (74.16 in Nov. '09 and 77.42 in Nov. '10) didn't make it down to the line.
This isn't to say the buck won't penetrate and close below that line. Last week, the low of 76.11 was perilously close. However, extreme sentiment against an asset class when that asset is at support lows is often the formula for a rise. The point here is that the trader must be careful. If she or he holds the opinion that the dollar is going down, this isn't exactly the place to jump in since it's holding support. That trader should already be short with profits locked in place. Going short now requires a close below the trend line and even then, one would want a tight stop. The profit potential is limited since the 75.62 prior swing low is just below. Why would anyone even be considering going short now? Talk about being late to the party. If everyone is already short (as the COT report shows), then who is left to sell? If you want to go short, read my blog on March 2 when I discussed the monthly chart and wait for a rally.
The trader who wants to go long is in a stronger position since the index is at support. However, the trader must actively manage the trade. Nonetheless, my bias is long at this point because the chart supports that position technically. If one went long and the pair closes beneath the trend line, it would be a warning. If price moves below 74.16 that would be the confirmation point for a double top and the hint for new, heart stopping lows.
Here's the weekly chart. It looks as though there was a data error for this week with the spike up so ignore the long upper shadow.

© Dianne Fecteau, 2011. No part of this material may be reproduced in any form, or referred to in any other publication, without the express written permission of the author.
My purpose in writing this blog is to show you how one trader, me, makes trading decisions and survives while trading Forex. One of the biggest problems I had when I first started trading was trying to apply the “rules” to actual trades. Another was the psychology—limiting losses and letting profits run. If you study my blog, you’ll see how I deal with both those issues. So my writings are not trade recommendations but rather educational in purpose. You have to decide on your own approach to trading. Remember that trading is risky.
This isn't to say the buck won't penetrate and close below that line. Last week, the low of 76.11 was perilously close. However, extreme sentiment against an asset class when that asset is at support lows is often the formula for a rise. The point here is that the trader must be careful. If she or he holds the opinion that the dollar is going down, this isn't exactly the place to jump in since it's holding support. That trader should already be short with profits locked in place. Going short now requires a close below the trend line and even then, one would want a tight stop. The profit potential is limited since the 75.62 prior swing low is just below. Why would anyone even be considering going short now? Talk about being late to the party. If everyone is already short (as the COT report shows), then who is left to sell? If you want to go short, read my blog on March 2 when I discussed the monthly chart and wait for a rally.
The trader who wants to go long is in a stronger position since the index is at support. However, the trader must actively manage the trade. Nonetheless, my bias is long at this point because the chart supports that position technically. If one went long and the pair closes beneath the trend line, it would be a warning. If price moves below 74.16 that would be the confirmation point for a double top and the hint for new, heart stopping lows.
Here's the weekly chart. It looks as though there was a data error for this week with the spike up so ignore the long upper shadow.

© Dianne Fecteau, 2011. No part of this material may be reproduced in any form, or referred to in any other publication, without the express written permission of the author.
My purpose in writing this blog is to show you how one trader, me, makes trading decisions and survives while trading Forex. One of the biggest problems I had when I first started trading was trying to apply the “rules” to actual trades. Another was the psychology—limiting losses and letting profits run. If you study my blog, you’ll see how I deal with both those issues. So my writings are not trade recommendations but rather educational in purpose. You have to decide on your own approach to trading. Remember that trading is risky.
Tuesday, March 8, 2011
USD Index—weekly
With all the negative sentiment, the greenback has continued to hold its uptrend line. This shows that if everyone is selling, there's nobody left to sell.
As I wrote last week, as long as it stays above 75.62, it's reasonable to expect a rally. There is no outstanding negative sell signal on the weekly chart. The trend, as difficult as it is to believe, is up for the last three years. However, there are strong rallies and equally strong pullbacks. The move down over the past eight weeks has a steep angle of descent which is difficult to maintain so I'd expect a rally because of this alone. In addition, the pair is also at the lower trend line. The next move, just as on the monthly chart with its triangle (not shown) should be up.
I wrote last week that the price targets for the monthly chart were 83.65, 85.00 and 87.73. The weekly chart adds a lower target of 79.02 (the downtrend line from the 2010 high of 88.66). Overcoming the prior high would require rising above 81.44.
RSI looks OK on the weekly chart. Note that it never dropped below 30—oversold—since 2008, despite the bearish sentiment.
If the index drops below 75.62, watch if it moves below 74.16. That would confirm a double top with its uh-oh connotations.
Here's the weekly chart:

© Dianne Fecteau, 2011. No part of this material may be reproduced in any form, or referred to in any other publication, without the express written permission of the author.
My purpose in writing this blog is to show you how one trader, me, makes trading decisions and survives while trading Forex. One of the biggest problems I had when I first started trading was trying to apply the “rules” to actual trades. Another was the psychology—limiting losses and letting profits run. If you study my blog, you’ll see how I deal with both those issues. So my writings are not trade recommendations but rather educational in purpose. You have to decide on your own approach to trading. Remember that trading is risky.
As I wrote last week, as long as it stays above 75.62, it's reasonable to expect a rally. There is no outstanding negative sell signal on the weekly chart. The trend, as difficult as it is to believe, is up for the last three years. However, there are strong rallies and equally strong pullbacks. The move down over the past eight weeks has a steep angle of descent which is difficult to maintain so I'd expect a rally because of this alone. In addition, the pair is also at the lower trend line. The next move, just as on the monthly chart with its triangle (not shown) should be up.
I wrote last week that the price targets for the monthly chart were 83.65, 85.00 and 87.73. The weekly chart adds a lower target of 79.02 (the downtrend line from the 2010 high of 88.66). Overcoming the prior high would require rising above 81.44.
RSI looks OK on the weekly chart. Note that it never dropped below 30—oversold—since 2008, despite the bearish sentiment.
If the index drops below 75.62, watch if it moves below 74.16. That would confirm a double top with its uh-oh connotations.
Here's the weekly chart:

© Dianne Fecteau, 2011. No part of this material may be reproduced in any form, or referred to in any other publication, without the express written permission of the author.
My purpose in writing this blog is to show you how one trader, me, makes trading decisions and survives while trading Forex. One of the biggest problems I had when I first started trading was trying to apply the “rules” to actual trades. Another was the psychology—limiting losses and letting profits run. If you study my blog, you’ll see how I deal with both those issues. So my writings are not trade recommendations but rather educational in purpose. You have to decide on your own approach to trading. Remember that trading is risky.
Wednesday, March 2, 2011
USD Index—Monthly
Clearly, the index is at the bottom of a triangle. Although the situation looks dire, the next move should be up.
If I interpret the triangle as an Elliott Wave triangle, it hasn't completed. The next move should be leg E up. However, using the same Elliott lens for interpretation, then one should expect the price action to be down after that point. E should end around 87.73 but the last waves of EW triangles often fall short. If this happens, I'd look for it to be about 83.65 or 85.00. The latter is about the point the long-term downtrend line enters the picture. This assumes you buy into EW theory. While I do find it sometimes useful, it's not a guaranty of anything and it can be useless.
One can look at this price behavior as basing behavior. Long downtrends don't turn around on a dime as it were. Notice that it is an upward trend line from the lows.
What about the lackluster performance of RSI? Given the overwhelming sentiment against the USD, this isn't surprising. However, from a technical point of view it's negative. Offsetting that, though, is the fact that RSI is also not plunging to oversold levels below 30 on each dip.
Until the index drops below 75.62, I believe there's going to be upwards movement in price. If it does begin to slide, watch if it moves below 74.16 because that would be the confirmation point for a double top and the hint that there will be new, heart stopping lows.
Here's the monthly chart:

© Dianne Fecteau, 2011. No part of this material may be reproduced in any form, or referred to in any other publication, without the express written permission of the author.
My purpose in writing this blog is to show you how one trader, me, makes trading decisions and survives while trading Forex. One of the biggest problems I had when I first started trading was trying to apply the “rules” to actual trades. Another was the psychology—limiting losses and letting profits run. If you study my blog, you’ll see how I deal with both those issues. So my writings are not trade recommendations but rather educational in purpose. You have to decide on your own approach to trading. Remember that trading is risky.
If I interpret the triangle as an Elliott Wave triangle, it hasn't completed. The next move should be leg E up. However, using the same Elliott lens for interpretation, then one should expect the price action to be down after that point. E should end around 87.73 but the last waves of EW triangles often fall short. If this happens, I'd look for it to be about 83.65 or 85.00. The latter is about the point the long-term downtrend line enters the picture. This assumes you buy into EW theory. While I do find it sometimes useful, it's not a guaranty of anything and it can be useless.
One can look at this price behavior as basing behavior. Long downtrends don't turn around on a dime as it were. Notice that it is an upward trend line from the lows.
What about the lackluster performance of RSI? Given the overwhelming sentiment against the USD, this isn't surprising. However, from a technical point of view it's negative. Offsetting that, though, is the fact that RSI is also not plunging to oversold levels below 30 on each dip.
Until the index drops below 75.62, I believe there's going to be upwards movement in price. If it does begin to slide, watch if it moves below 74.16 because that would be the confirmation point for a double top and the hint that there will be new, heart stopping lows.
Here's the monthly chart:

© Dianne Fecteau, 2011. No part of this material may be reproduced in any form, or referred to in any other publication, without the express written permission of the author.
My purpose in writing this blog is to show you how one trader, me, makes trading decisions and survives while trading Forex. One of the biggest problems I had when I first started trading was trying to apply the “rules” to actual trades. Another was the psychology—limiting losses and letting profits run. If you study my blog, you’ll see how I deal with both those issues. So my writings are not trade recommendations but rather educational in purpose. You have to decide on your own approach to trading. Remember that trading is risky.
Wednesday, February 16, 2011
USDX—weekly
It's been a while since I've discussed the USDX. Despite all the gloom and doom around the USD, there hasn't been a lot to say. The index is still tracking upward with three (almost four) touches on the uptrend line since the lows in 2008. The negative divergence appears to be working itself out. 76.87 formed on the low of a hanging man candle should be support.
Here's the chart:

© Dianne Fecteau, 2011. No part of this material may be reproduced in any form, or referred to in any other publication, without the express written permission of the author.
My purpose in writing this blog is to show you how one trader, me, makes trading decisions and survives while trading Forex. One of the biggest problems I had when I first started trading was trying to apply the “rules” to actual trades. Another was the psychology—limiting losses and letting profits run. If you study my blog, you’ll see how I deal with both those issues. So my writings are not trade recommendations but rather educational in purpose. You have to decide on your own approach to trading. Remember that trading is risky.
Here's the chart:

© Dianne Fecteau, 2011. No part of this material may be reproduced in any form, or referred to in any other publication, without the express written permission of the author.
My purpose in writing this blog is to show you how one trader, me, makes trading decisions and survives while trading Forex. One of the biggest problems I had when I first started trading was trying to apply the “rules” to actual trades. Another was the psychology—limiting losses and letting profits run. If you study my blog, you’ll see how I deal with both those issues. So my writings are not trade recommendations but rather educational in purpose. You have to decide on your own approach to trading. Remember that trading is risky.
Tuesday, December 28, 2010
Thin Holiday Markets
The market is very thin with little liquidity. This hasn't stopped the sell-off in the USD or the ongoing appreciation of the CHF against all currencies. The best approach for small traders is to stand aside until normal market volume resumes in early January. Barring that, one could take very short-term, intraday trades but that's certainly not something I'm going to do.
© Dianne Fecteau, 2010. No part of this material may be reproduced in any form, or referred to in any other publication, without the express written permission of the author.
My purpose in writing this blog is to show you how one trader, me, makes trading decisions and survives while trading Forex. One of the biggest problems I had when I first started trading was trying to apply the “rules” to actual trades. Another was the psychology—limiting losses and letting profits run. If you study my blog, you’ll see how I deal with both those issues. So my writings are not trade recommendations but rather educational in purpose. You have to decide on your own approach to trading. Remember that trading is risky.
© Dianne Fecteau, 2010. No part of this material may be reproduced in any form, or referred to in any other publication, without the express written permission of the author.
My purpose in writing this blog is to show you how one trader, me, makes trading decisions and survives while trading Forex. One of the biggest problems I had when I first started trading was trying to apply the “rules” to actual trades. Another was the psychology—limiting losses and letting profits run. If you study my blog, you’ll see how I deal with both those issues. So my writings are not trade recommendations but rather educational in purpose. You have to decide on your own approach to trading. Remember that trading is risky.
Friday, December 17, 2010
USD Index—Daily
The USD index has managed to hold above its 77.98 low this week and while this is good news for the USD it also raises the bar a bit in that it now should hold above 78.82, Tuesday's low. On the daily chart below one could argue that an ABC correction is in place. Nearby resistance is 81.44 and a move over 83.60, the next resistance, would be very bullish for the buck. Again, though, with the thin holiday markets, it's not clear this will happen next week. Support is 77.98 and 75.63.
Here's the daily chart:

© Dianne Fecteau, 2010. No part of this material may be reproduced in any form, or referred to in any other publication, without the express written permission of the author.
My purpose in writing this blog is to show you how one trader, me, makes trading decisions and survives while trading Forex. One of the biggest problems I had when I first started trading was trying to apply the “rules” to actual trades. Another was the psychology—limiting losses and letting profits run. If you study my blog, you’ll see how I deal with both those issues. So my writings are not trade recommendations but rather educational in purpose. You have to decide on your own approach to trading. Remember that trading is risky.
Here's the daily chart:

© Dianne Fecteau, 2010. No part of this material may be reproduced in any form, or referred to in any other publication, without the express written permission of the author.
My purpose in writing this blog is to show you how one trader, me, makes trading decisions and survives while trading Forex. One of the biggest problems I had when I first started trading was trying to apply the “rules” to actual trades. Another was the psychology—limiting losses and letting profits run. If you study my blog, you’ll see how I deal with both those issues. So my writings are not trade recommendations but rather educational in purpose. You have to decide on your own approach to trading. Remember that trading is risky.
Monday, December 13, 2010
USD Index Monthly
The shadow of November's candle on the monthly chart below dipped below the uptrend line which is not good news. That particular low of 75.63 came on the day the Fed announced the latest news of quantitative easing (November 4th). It does need to hold and better would be holding the low of 77.98 from later in the month. However, as we're in the thin holiday markets extreme moves can happen without meaning much technically.
There's a lot of indecision out there. The USD is poised technically to go higher yet the last three days of last week were basically sideways movement. Nonetheless, with the strong support and the strong November candle, one would expect from the monthly chart that the next move will be up. Here's the chart:

© Dianne Fecteau, 2010. No part of this material may be reproduced in any form, or referred to in any other publication, without the express written permission of the author.
My purpose in writing this blog is to show you how one trader, me, makes trading decisions and survives while trading Forex. One of the biggest problems I had when I first started trading was trying to apply the “rules” to actual trades. Another was the psychology—limiting losses and letting profits run. If you study my blog, you’ll see how I deal with both those issues. So my writings are not trade recommendations but rather educational in purpose. You have to decide on your own approach to trading. Remember that trading is risky.
There's a lot of indecision out there. The USD is poised technically to go higher yet the last three days of last week were basically sideways movement. Nonetheless, with the strong support and the strong November candle, one would expect from the monthly chart that the next move will be up. Here's the chart:

© Dianne Fecteau, 2010. No part of this material may be reproduced in any form, or referred to in any other publication, without the express written permission of the author.
My purpose in writing this blog is to show you how one trader, me, makes trading decisions and survives while trading Forex. One of the biggest problems I had when I first started trading was trying to apply the “rules” to actual trades. Another was the psychology—limiting losses and letting profits run. If you study my blog, you’ll see how I deal with both those issues. So my writings are not trade recommendations but rather educational in purpose. You have to decide on your own approach to trading. Remember that trading is risky.
Friday, December 3, 2010
USD Pairs
The USD is falling after the weaker than expected numbers. Be careful, though. This isn't about currency strength in the Euro so much as it is about the USD. I don't talk much about fundamental factors in this blog but the reality is that Eurozone has higher unemployment than the US. More importantly, unemployment is a lagging factor in an economy—it improves last. So you can't make firm conclusions about things just from this. Well, maybe you can draw one conclusion—the market is full of kneejerk reactions to news. I'm not suggesting the US economy is out of the woods by any means. But even if you believe the Euro, AUD, whatever, will continue up, use tight stops. Some significant resistance levels are being approached that I've blogged about earlier in the week.
See you Monday.
© Dianne Fecteau, 2010. No part of this material may be reproduced in any form, or referred to in any other publication, without the express written permission of the author.
My purpose in writing this blog is to show you how one trader, me, makes trading decisions and survives while trading Forex. One of the biggest problems I had when I first started trading was trying to apply the “rules” to actual trades. Another was the psychology—limiting losses and letting profits run. If you study my blog, you’ll see how I deal with both those issues. So my writings are not trade recommendations but rather educational in purpose. You have to decide on your own approach to trading. Remember that trading is risky.
See you Monday.
© Dianne Fecteau, 2010. No part of this material may be reproduced in any form, or referred to in any other publication, without the express written permission of the author.
My purpose in writing this blog is to show you how one trader, me, makes trading decisions and survives while trading Forex. One of the biggest problems I had when I first started trading was trying to apply the “rules” to actual trades. Another was the psychology—limiting losses and letting profits run. If you study my blog, you’ll see how I deal with both those issues. So my writings are not trade recommendations but rather educational in purpose. You have to decide on your own approach to trading. Remember that trading is risky.
Monday, October 25, 2010
USDX—Monthly
As I suspected, the USDX is holding above its uptrend line on the monthly chart, bouncing from its low this month of 7614 before rallying. Its low so far today is 7720. While there may be another retest of the 7614 area, possibly even somewhat lower, one can view this as the bottom of a deep correction and reasonably expect a rally. This would imply that dollar pairs (EUR/USD, GBP/USD) will decline over the next week or so. However, the dollar must get cleanly above 78.50 for this to happen.
Here’s the monthly chart:

© Dianne Fecteau, 2010. No part of this material may be reproduced in any form, or referred to in any other publication, without the express written permission of the author.
My purpose in writing this blog is to show you how one trader, me, makes trading decisions and survives while trading Forex. One of the biggest problems I had when I first started trading was trying to apply the “rules” to actual trades. Another was the psychology—limiting losses and letting profits run. If you study my blog, you’ll see how I deal with both those issues. So my writings are not trade recommendations but rather educational in purpose. You have to decide on your own approach to trading. Remember that trading is risky.
Here’s the monthly chart:

© Dianne Fecteau, 2010. No part of this material may be reproduced in any form, or referred to in any other publication, without the express written permission of the author.
My purpose in writing this blog is to show you how one trader, me, makes trading decisions and survives while trading Forex. One of the biggest problems I had when I first started trading was trying to apply the “rules” to actual trades. Another was the psychology—limiting losses and letting profits run. If you study my blog, you’ll see how I deal with both those issues. So my writings are not trade recommendations but rather educational in purpose. You have to decide on your own approach to trading. Remember that trading is risky.
Monday, October 18, 2010
USD Index--Monthly
When I ran the monthly chart this past Saturday, the index had just about touched its monthly uptrend line. One should see a bounce from the touch and given the behavior of some of the dollar pairs I think it's more likely than not.
There's still all that negative dollar sentiment and the Fed is sure to continue its less than effective quantitative easing. Have you ever seen a market bounce in those doomsday conditions? I have. Stay tuned. If the index begins to approach 78, there may in fact be a decent rally, at least up to the top of the symmetrical triangle.
Here's the monthly chart:

© Dianne Fecteau, 2010. No part of this material may be reproduced in any form, or referred to in any other publication, without the express written permission of the author.
My purpose in writing this blog is to show you how one trader, me, makes trading decisions and survives while trading Forex. One of the biggest problems I had when I first started trading was trying to apply the “rules” to actual trades. Another was the psychology—limiting losses and letting profits run. If you study my blog, you’ll see how I deal with both those issues. So my writings are not trade recommendations but rather educational in purpose. You have to decide on your own approach to trading. Remember that trading is risky.
There's still all that negative dollar sentiment and the Fed is sure to continue its less than effective quantitative easing. Have you ever seen a market bounce in those doomsday conditions? I have. Stay tuned. If the index begins to approach 78, there may in fact be a decent rally, at least up to the top of the symmetrical triangle.
Here's the monthly chart:

© Dianne Fecteau, 2010. No part of this material may be reproduced in any form, or referred to in any other publication, without the express written permission of the author.
My purpose in writing this blog is to show you how one trader, me, makes trading decisions and survives while trading Forex. One of the biggest problems I had when I first started trading was trying to apply the “rules” to actual trades. Another was the psychology—limiting losses and letting profits run. If you study my blog, you’ll see how I deal with both those issues. So my writings are not trade recommendations but rather educational in purpose. You have to decide on your own approach to trading. Remember that trading is risky.
Monday, October 11, 2010
USD Index--Monthly
It has been a while since I've blogged about the USD Index. You can see on the monthly chart below that it's moving towards its uptrend line. This is around 76. The concerns about the Fed increasing its quantitative easing as well as the many dollar bears out there may hasten this move down. At that point there will most likely be a bounce.
It's difficult to not notice the large symmetrical triangle on the chart. Often these are continuation moves. If so, there will be significantly lower lows for the USD. If you look at the triangle from an Elliott Wave perspective, then it can also be expected to break downward. However from that perspective it hasn't yet touched the "D" point so one can expect a move up to E before it broke down completely. Given that so many of the USD pairs are over-extended in their moves it's another piece of evidence that one will want to be short Euro and long the dollar at some point, probably sooner rather than later.
Here's a monthly chart:

© Dianne Fecteau, 2010. No part of this material may be reproduced in any form, or referred to in any other publication, without the express written permission of the author.
My purpose in writing this blog is to show you how one trader, me, makes trading decisions and survives while trading Forex. One of the biggest problems I had when I first started trading was trying to apply the “rules” to actual trades. Another was the psychology—limiting losses and letting profits run. If you study my blog, you’ll see how I deal with both those issues. So my writings are not trade recommendations but rather educational in purpose. You have to decide on your own approach to trading. Remember that trading is risky.
It's difficult to not notice the large symmetrical triangle on the chart. Often these are continuation moves. If so, there will be significantly lower lows for the USD. If you look at the triangle from an Elliott Wave perspective, then it can also be expected to break downward. However from that perspective it hasn't yet touched the "D" point so one can expect a move up to E before it broke down completely. Given that so many of the USD pairs are over-extended in their moves it's another piece of evidence that one will want to be short Euro and long the dollar at some point, probably sooner rather than later.
Here's a monthly chart:

© Dianne Fecteau, 2010. No part of this material may be reproduced in any form, or referred to in any other publication, without the express written permission of the author.
My purpose in writing this blog is to show you how one trader, me, makes trading decisions and survives while trading Forex. One of the biggest problems I had when I first started trading was trying to apply the “rules” to actual trades. Another was the psychology—limiting losses and letting profits run. If you study my blog, you’ll see how I deal with both those issues. So my writings are not trade recommendations but rather educational in purpose. You have to decide on your own approach to trading. Remember that trading is risky.
Tuesday, July 27, 2010
USD Index—Monthly
Yesterday saw another low for the buck. A look at the monthly chart provides some interesting insights.
First, note what seems to be the pronounced evening star (I circled it) currently forming. We won’t know for sure until the month is finished but this kind of three-candle formation after an uptrend is bearish. Since it’s occurring at resistance, it could mean there is further down potential for the dollar. Second, the pair is coiling within a symmetrical triangle and it’s not unreasonable to think it may be headed to the bottom of the triangle which would be about 75.42. (That would give the gold-hoarding doom and gloomers something to hop up and down about.)
One could also make the case for an ABC correction. I don’t think that’s as likely but one might as well look at the possibilities. The reason I don’t think it’s likely is that the retracement was 82% of the move from the 2005 high of 92.63 to the 70.70 low and that’s a pretty steep retracement. One wouldn’t expect to see that if the underlying trend was strong. It makes more sense to see it as having completed wave one and two and beginning wave three.
Another thing that’s encouraging on this chart is the RSI. It’s maintaining a nice upward line and at the Nov. 2009 dip stayed above 40. That doesn’t sound very bearish.
Finally, it’s at support now with polarity and price support and it’s close to a Fib confluence area at 81.66. There’s additional support down to 79.50.
So what to conclude from all this for a longer term bias? Given the potential EW third wave, the RSI, and the current and nearby support levels, I have a positive bias. That evening star is gruesome and the symmetrical triangle is compelling however, so I’m not sure I’d jump into long positions at the moment. What it really says is that I need to now drop down and analyze shorter term charts.
Here’s the monthly chart:

© Dianne Fecteau, 2010. No part of this material may be reproduced in any form, or referred to in any other publication, without the express written permission of the author.
My purpose in writing this blog is to show you how one trader, me, makes trading decisions and survives while trading Forex. One of the biggest problems I had when I first started trading was trying to apply the “rules” to actual trades. Another was the psychology—limiting losses and letting profits run. If you study my blog, you’ll see how I deal with both those issues. So my writings are not trade recommendations but rather educational in purpose. You have to decide on your own approach to trading. Remember that trading is risky.
First, note what seems to be the pronounced evening star (I circled it) currently forming. We won’t know for sure until the month is finished but this kind of three-candle formation after an uptrend is bearish. Since it’s occurring at resistance, it could mean there is further down potential for the dollar. Second, the pair is coiling within a symmetrical triangle and it’s not unreasonable to think it may be headed to the bottom of the triangle which would be about 75.42. (That would give the gold-hoarding doom and gloomers something to hop up and down about.)
One could also make the case for an ABC correction. I don’t think that’s as likely but one might as well look at the possibilities. The reason I don’t think it’s likely is that the retracement was 82% of the move from the 2005 high of 92.63 to the 70.70 low and that’s a pretty steep retracement. One wouldn’t expect to see that if the underlying trend was strong. It makes more sense to see it as having completed wave one and two and beginning wave three.
Another thing that’s encouraging on this chart is the RSI. It’s maintaining a nice upward line and at the Nov. 2009 dip stayed above 40. That doesn’t sound very bearish.
Finally, it’s at support now with polarity and price support and it’s close to a Fib confluence area at 81.66. There’s additional support down to 79.50.
So what to conclude from all this for a longer term bias? Given the potential EW third wave, the RSI, and the current and nearby support levels, I have a positive bias. That evening star is gruesome and the symmetrical triangle is compelling however, so I’m not sure I’d jump into long positions at the moment. What it really says is that I need to now drop down and analyze shorter term charts.
Here’s the monthly chart:

© Dianne Fecteau, 2010. No part of this material may be reproduced in any form, or referred to in any other publication, without the express written permission of the author.
My purpose in writing this blog is to show you how one trader, me, makes trading decisions and survives while trading Forex. One of the biggest problems I had when I first started trading was trying to apply the “rules” to actual trades. Another was the psychology—limiting losses and letting profits run. If you study my blog, you’ll see how I deal with both those issues. So my writings are not trade recommendations but rather educational in purpose. You have to decide on your own approach to trading. Remember that trading is risky.
Monday, June 21, 2010
USD Index—Daily
OK, now that the USD Index made the high that I blogged about throughout May, it is correcting downward. How far could it go?
Using a simple correction of down to the uptrend line would target 83.75. Using Elliott Wave (EW), one could expect a correction to take an ABC formation with A already underway. One guideline (not a rule) is that the prior fourth wave low could be a target which would be 85.13. That would also be about 75% of the move up from the May 10th hammer low at 84.16. There would then be a move up for wave B and then wave C would take it down further, possibly to the uptrend line. As it unfolds over the next few days, I'll be able to refine this. There's an EW count on the weekly chart that hints it could go lower but let's not worry about that yet. Finally, one could look at a 50% retracement of the move up from November which would bring it to 81.44 but that’s too extreme for right now.
Here's the daily chart:

© Dianne Fecteau, 2010. No part of this material may be reproduced in any form, or referred to in any other publication, without the express written permission of the author.
My purpose in writing this blog is to show you how one trader, me, makes trading decisions and survives while trading Forex. One of the biggest problems I had when I first started trading was trying to apply the “rules” to actual trades. Another was the psychology—limiting losses and letting profits run. If you study my blog, you’ll see how I deal with both those issues. So my writings are not trade recommendations but rather educational in purpose. You have to decide on your own approach to trading. Remember that trading is risky.
Using a simple correction of down to the uptrend line would target 83.75. Using Elliott Wave (EW), one could expect a correction to take an ABC formation with A already underway. One guideline (not a rule) is that the prior fourth wave low could be a target which would be 85.13. That would also be about 75% of the move up from the May 10th hammer low at 84.16. There would then be a move up for wave B and then wave C would take it down further, possibly to the uptrend line. As it unfolds over the next few days, I'll be able to refine this. There's an EW count on the weekly chart that hints it could go lower but let's not worry about that yet. Finally, one could look at a 50% retracement of the move up from November which would bring it to 81.44 but that’s too extreme for right now.
Here's the daily chart:

© Dianne Fecteau, 2010. No part of this material may be reproduced in any form, or referred to in any other publication, without the express written permission of the author.
My purpose in writing this blog is to show you how one trader, me, makes trading decisions and survives while trading Forex. One of the biggest problems I had when I first started trading was trying to apply the “rules” to actual trades. Another was the psychology—limiting losses and letting profits run. If you study my blog, you’ll see how I deal with both those issues. So my writings are not trade recommendations but rather educational in purpose. You have to decide on your own approach to trading. Remember that trading is risky.
Thursday, June 10, 2010
USD Index—at resistance
As I pointed out in my blog post May 6, the dollar could go to its downtrend line on the weekly chart before getting pushed back. It's close. If one wants to stay with the simple argument (as opposed to all the gobbledy-gook that passes for analysis in some places) one could take the approach that it may head down for a while now. If it starts to get serious about staying below 87.50, this is the most likely scenario.
Here's the weekly chart:

© Dianne Fecteau, 2010. No part of this material may be reproduced in any form, or referred to in any other publication, without the express written permission of the author.
My purpose in writing this blog is to show you how one trader, me, makes trading decisions and survives while trading Forex. One of the biggest problems I had when I first started trading was trying to apply the “rules” to actual trades. Another was the psychology—limiting losses and letting profits run. If you study my blog, you’ll see how I deal with both those issues. So my writings are not trade recommendations but rather educational in purpose. You have to decide on your own approach to trading. Remember that trading is risky.
Here's the weekly chart:

© Dianne Fecteau, 2010. No part of this material may be reproduced in any form, or referred to in any other publication, without the express written permission of the author.
My purpose in writing this blog is to show you how one trader, me, makes trading decisions and survives while trading Forex. One of the biggest problems I had when I first started trading was trying to apply the “rules” to actual trades. Another was the psychology—limiting losses and letting profits run. If you study my blog, you’ll see how I deal with both those issues. So my writings are not trade recommendations but rather educational in purpose. You have to decide on your own approach to trading. Remember that trading is risky.
Thursday, June 3, 2010
USD Index—Weekly
For the last three days the index has had trouble with the 87.45 area but if it clears this then it will be on track to reach the downtrend line at 88.70 that I blogged about on May 6th. On the daily chart (not shown) there's a bullish pennant that, if it pans out, could get the index to 93. However it will be interesting to watch to see if this week's close tomorrow results in a doji. If so, and if then next week's candle closes deep within last week's up candle, this would complete an evening star formation.
Here's the weekly chart:

© Dianne Fecteau, 2010. No part of this material may be reproduced in any form, or referred to in any other publication, without the express written permission of the author.
My purpose in writing this blog is to show you how one trader, me, makes trading decisions and survives while trading Forex. One of the biggest problems I had when I first started trading was trying to apply the “rules” to actual trades. Another was the psychology—limiting losses and letting profits run. If you study my blog, you’ll see how I deal with both those issues. So my writings are not trade recommendations but rather educational in purpose. You have to decide on your own approach to trading. Remember that trading is risky.
Here's the weekly chart:

© Dianne Fecteau, 2010. No part of this material may be reproduced in any form, or referred to in any other publication, without the express written permission of the author.
My purpose in writing this blog is to show you how one trader, me, makes trading decisions and survives while trading Forex. One of the biggest problems I had when I first started trading was trying to apply the “rules” to actual trades. Another was the psychology—limiting losses and letting profits run. If you study my blog, you’ll see how I deal with both those issues. So my writings are not trade recommendations but rather educational in purpose. You have to decide on your own approach to trading. Remember that trading is risky.
Tuesday, May 18, 2010
USD Index—Weekly
When I blogged on May 6th that the USD could extend up to resistance on the weekly chart at 88.70, I’m sure some thought I was deranged. However it looks more and more realistic, doesn’t it, now that the high was 87.06 yesterday? If it overcomes that resistance it’s possible the Mar. ’09 high of 89.71 is accessible.
Despite those lofty thoughts, though, it’s important to note that the run since the 4/17 low has been almost straight up. This is unsustainable. It reflects the emotion that’s driving the market. The most prudent course is to not jump on board if you’re not already long. There is a Gann angle line that is coming in about where price is now so this serves as a bit of downward pressure as well. Yesterday’s candle was a doji, which after an uptrend can be a good reversal signal. One can reasonably expect a pullback to either of the less steep uptrend lines—either 82 or 75. At 82 people will start trashing the USD and at 75 they’ll be consigning it to the graveyard again. Either would be a desirable long trade.
Here’s the weekly chart:

© Dianne Fecteau, 2010. No part of this material may be reproduced in any form, or referred to in any other publication, without the express written permission of the author.
My purpose in writing this blog is to show you how one trader, me, makes trading decisions and survives while trading Forex. One of the biggest problems I had when I first started trading was trying to apply the “rules” to actual trades. Another was the psychology—limiting losses and letting profits run. If you study my blog, you’ll see how I deal with both those issues. So my writings are not trade recommendations but rather educational in purpose. You have to decide on your own approach to trading. Remember that trading is risky.
Despite those lofty thoughts, though, it’s important to note that the run since the 4/17 low has been almost straight up. This is unsustainable. It reflects the emotion that’s driving the market. The most prudent course is to not jump on board if you’re not already long. There is a Gann angle line that is coming in about where price is now so this serves as a bit of downward pressure as well. Yesterday’s candle was a doji, which after an uptrend can be a good reversal signal. One can reasonably expect a pullback to either of the less steep uptrend lines—either 82 or 75. At 82 people will start trashing the USD and at 75 they’ll be consigning it to the graveyard again. Either would be a desirable long trade.
Here’s the weekly chart:

© Dianne Fecteau, 2010. No part of this material may be reproduced in any form, or referred to in any other publication, without the express written permission of the author.
My purpose in writing this blog is to show you how one trader, me, makes trading decisions and survives while trading Forex. One of the biggest problems I had when I first started trading was trying to apply the “rules” to actual trades. Another was the psychology—limiting losses and letting profits run. If you study my blog, you’ll see how I deal with both those issues. So my writings are not trade recommendations but rather educational in purpose. You have to decide on your own approach to trading. Remember that trading is risky.
Subscribe to:
Posts (Atom)
